
Resources
Guides, research, and perspectives on R&D intelligence, IP strategy, and the future of AI enabled innovation.

Executive Summary
In 2024, US patent infringement jury verdicts totaled $4.19 billion across 72 cases. Twelve individual verdicts exceeded $100million. The largest single award—$857 million in General Access Solutions v.Cellco Partnership (Verizon)—exceeded the annual R&D budget of many mid-market technology companies. In the first half of 2025 alone, total damages reached an additional $1.91 billion.
The consequences of incomplete patent intelligence are not abstract. In what has become one of the most instructive IP disputes in recent history, Masimo’s pulse oximetry patents triggered a US import ban on certain Apple Watch models, forcing Apple to disable its blood oxygen feature across an entire product line, halt domestic sales of affected models, invest in a hardware redesign, and ultimately face a $634 million jury verdict in November 2025. Apple—a company with one of the most sophisticated intellectual property organizations on earth—spent years in litigation over technology it might have designed around during development.
For organizations with fewer resources than Apple, the risk calculus is starker. A mid-size materials company, a university spinout, or a defense contractor developing next-generation battery technology cannot absorb a nine-figure verdict or a multi-year injunction. For these organizations, the patent landscape analysis conducted during the development phase is the primary risk mitigation mechanism. The quality of that analysis is not a matter of convenience. It is a matter of survival.
And yet, a growing number of R&D and IP teams are conducting that analysis using general-purpose AI tools—ChatGPT, Claude, Microsoft Co-Pilot—that were never designed for patent intelligence and are structurally incapable of delivering it.
This report presents the findings of a controlled comparison study in which identical patent landscape queries were submitted to four AI-powered tools: Cypris (a purpose-built R&D intelligence platform),ChatGPT (OpenAI), Claude (Anthropic), and Microsoft Co-Pilot. Two technology domains were tested: solid-state lithium-sulfur battery electrolytes using garnet-type LLZO ceramic materials (freedom-to-operate analysis), and bio-based polyamide synthesis from castor oil derivatives (competitive intelligence).
The results reveal a significant and structurally persistent gap. In Test 1, Cypris identified over 40 active US patents and published applications with granular FTO risk assessments. Claude identified 12. ChatGPT identified 7, several with fabricated attribution. Co-Pilot identified 4. Among the patents surfaced exclusively by Cypris were filings rated as “Very High” FTO risk that directly claim the technology architecture described in the query. In Test 2, Cypris cited over 100 individual patent filings with full attribution to substantiate its competitive landscape rankings. No general-purpose model cited a single patent number.
The most active sectors for patent enforcement—semiconductors, AI, biopharma, and advanced materials—are the same sectors where R&D teams are most likely to adopt AI tools for intelligence workflows. The findings of this report have direct implications for any organization using general-purpose AI to inform patent strategy, competitive intelligence, or R&D investment decisions.

1. Methodology
A single patent landscape query was submitted verbatim to each tool on March 27, 2026. No follow-up prompts, clarifications, or iterative refinements were provided. Each tool received one opportunity to respond, mirroring the workflow of a practitioner running an initial landscape scan.
1.1 Query
Identify all active US patents and published applications filed in the last 5 years related to solid-state lithium-sulfur battery electrolytes using garnet-type ceramic materials. For each, provide the assignee, filing date, key claims, and current legal status. Highlight any patents that could pose freedom-to-operate risks for a company developing a Li₇La₃Zr₂O₁₂(LLZO)-based composite electrolyte with a polymer interlayer.
1.2 Tools Evaluated

1.3 Evaluation Criteria
Each response was assessed across six dimensions: (1) number of relevant patents identified, (2) accuracy of assignee attribution,(3) completeness of filing metadata (dates, legal status), (4) depth of claim analysis relative to the proposed technology, (5) quality of FTO risk stratification, and (6) presence of actionable design-around or strategic guidance.
2. Findings
2.1 Coverage Gap
The most significant finding is the scale of the coverage differential. Cypris identified over 40 active US patents and published applications spanning LLZO-polymer composite electrolytes, garnet interface modification, polymer interlayer architectures, lithium-sulfur specific filings, and adjacent ceramic composite patents. The results were organized by technology category with per-patent FTO risk ratings.
Claude identified 12 patents organized in a four-tier risk framework. Its analysis was structurally sound and correctly flagged the two highest-risk filings (Solid Energies US 11,967,678 and the LLZO nanofiber multilayer US 11,923,501). It also identified the University ofMaryland/ Wachsman portfolio as a concentration risk and noted the NASA SABERS portfolio as a licensing opportunity. However, it missed the majority of the landscape, including the entire Corning portfolio, GM's interlayer patents, theKorea Institute of Energy Research three-layer architecture, and the HonHai/SolidEdge lithium-sulfur specific filing.
ChatGPT identified 7 patents, but the quality of attribution was inconsistent. It listed assignees as "Likely DOE /national lab ecosystem" and "Likely startup / defense contractor cluster" for two filings—language that indicates the model was inferring rather than retrieving assignee data. In a freedom-to-operate context, an unverified assignee attribution is functionally equivalent to no attribution, as it cannot support a licensing inquiry or risk assessment.
Co-Pilot identified 4 US patents. Its output was the most limited in scope, missing the Solid Energies portfolio entirely, theUMD/ Wachsman portfolio, Gelion/ Johnson Matthey, NASA SABERS, and all Li-S specific LLZO filings.
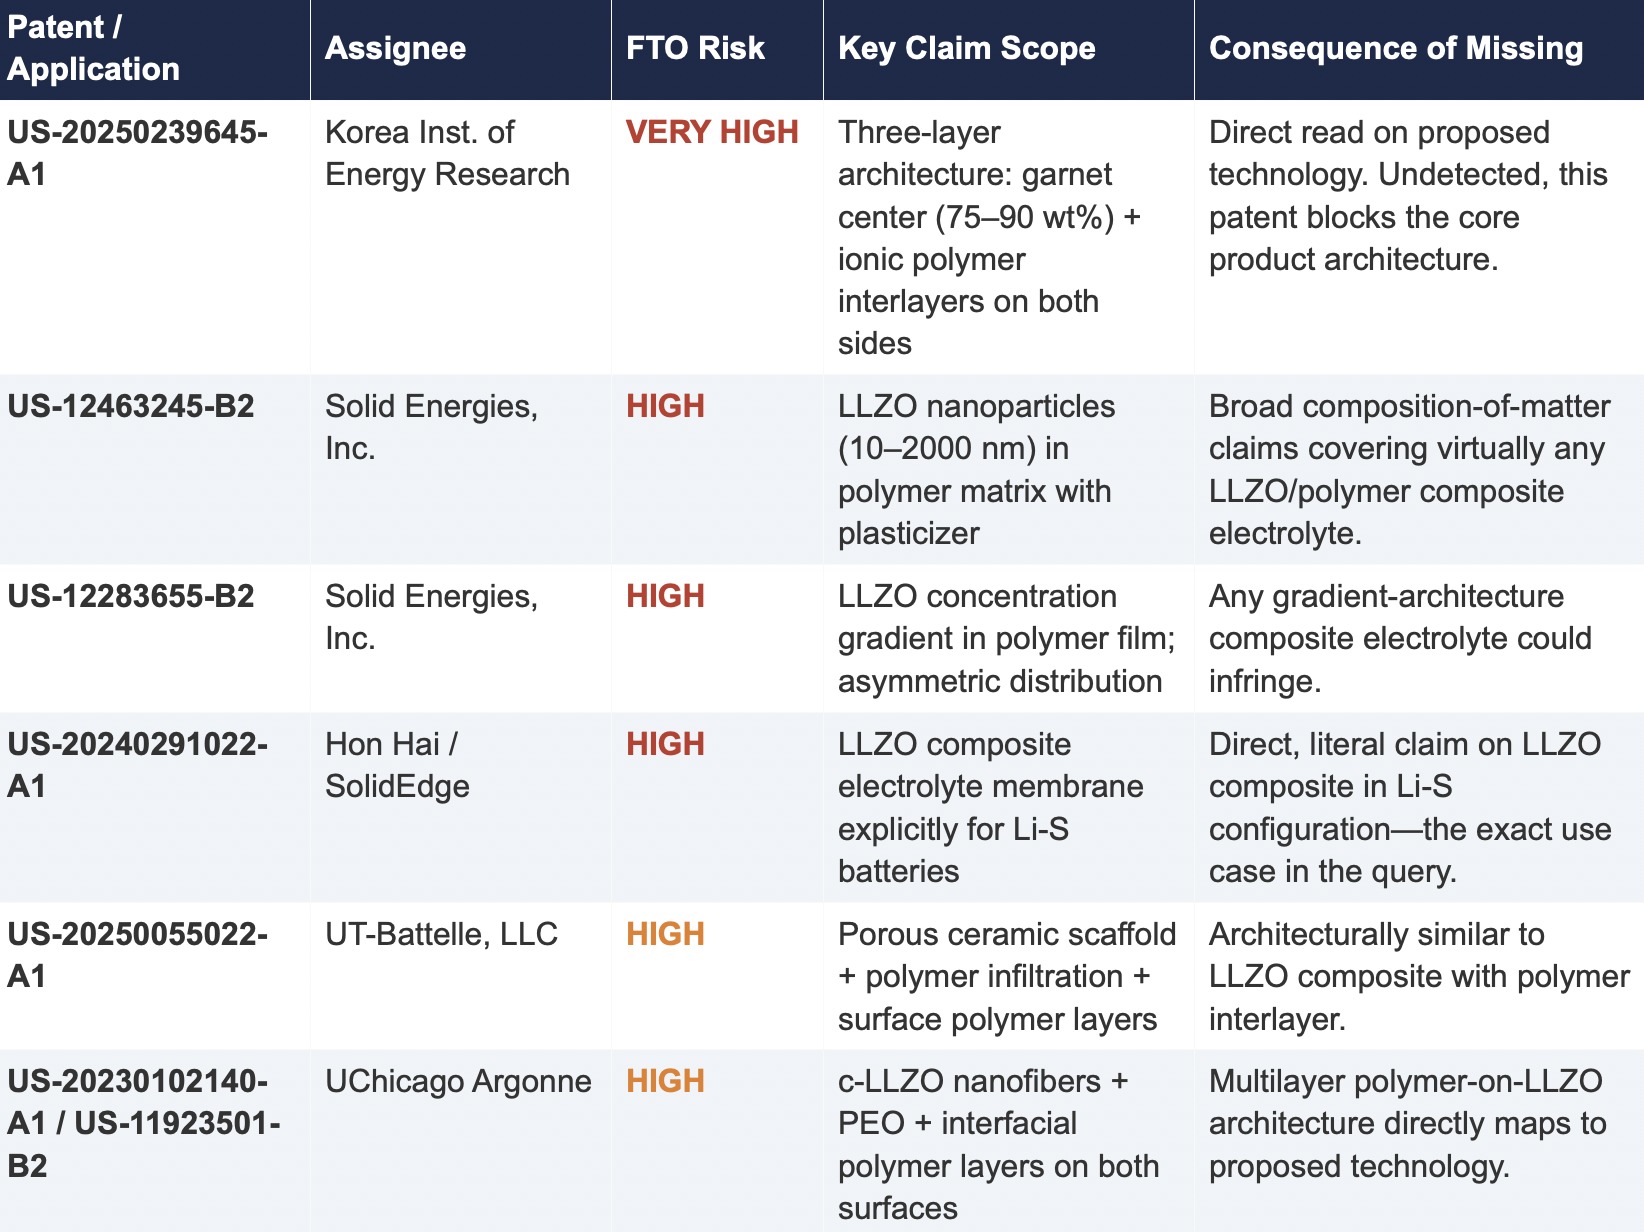
2.2 Critical Patents Missed by Public Models
The following table presents patents identified exclusively by Cypris that were rated as High or Very High FTO risk for the proposed technology architecture. None were surfaced by any general-purpose model.
2.3 Patent Fencing: The Solid Energies Portfolio
Cypris identified a coordinated patent fencing strategy by Solid Energies, Inc. that no general-purpose model detected at scale. Solid Energies holds at least four granted US patents and one published application covering LLZO-polymer composite electrolytes across compositions(US-12463245-B2), gradient architectures (US-12283655-B2), electrode integration (US-12463249-B2), and manufacturing processes (US-20230035720-A1). Claude identified one Solid Energies patent (US 11,967,678) and correctly rated it as the highest-priority FTO concern but did not surface the broader portfolio. ChatGPT and Co-Pilot identified zero Solid Energies filings.
The practical significance is that a company relying on any individual patent hit would underestimate the scope of Solid Energies' IP position. The fencing strategy—covering the composition, the architecture, the electrode integration, and the manufacturing method—means that identifying a single design-around for one patent does not resolve the FTO exposure from the portfolio as a whole. This is the kind of strategic insight that requires seeing the full picture, which no general-purpose model delivered
2.4 Assignee Attribution Quality
ChatGPT's response included at least two instances of fabricated or unverifiable assignee attributions. For US 11,367,895 B1, the listed assignee was "Likely startup / defense contractor cluster." For US 2021/0202983 A1, the assignee was described as "Likely DOE / national lab ecosystem." In both cases, the model appears to have inferred the assignee from contextual patterns in its training data rather than retrieving the information from patent records.
In any operational IP workflow, assignee identity is foundational. It determines licensing strategy, litigation risk, and competitive positioning. A fabricated assignee is more dangerous than a missing one because it creates an illusion of completeness that discourages further investigation. An R&D team receiving this output might reasonably conclude that the landscape analysis is finished when it is not.
3. Structural Limitations of General-Purpose Models for Patent Intelligence
3.1 Training Data Is Not Patent Data
Large language models are trained on web-scraped text. Their knowledge of the patent record is derived from whatever fragments appeared in their training corpus: blog posts mentioning filings, news articles about litigation, snippets of Google Patents pages that were crawlable at the time of data collection. They do not have systematic, structured access to the USPTO database. They cannot query patent classification codes, parse claim language against a specific technology architecture, or verify whether a patent has been assigned, abandoned, or subjected to terminal disclaimer since their training data was collected.
This is not a limitation that improves with scale. A larger training corpus does not produce systematic patent coverage; it produces a larger but still arbitrary sampling of the patent record. The result is that general-purpose models will consistently surface well-known patents from heavily discussed assignees (QuantumScape, for example, appeared in most responses) while missing commercially significant filings from less publicly visible entities (Solid Energies, Korea Institute of EnergyResearch, Shenzhen Solid Advanced Materials).
3.2 The Web Is Closing to Model Scrapers
The data access problem is structural and worsening. As of mid-2025, Cloudflare reported that among the top 10,000 web domains, the majority now fully disallow AI crawlers such as GPTBot andClaudeBot via robots.txt. The trend has accelerated from partial restrictions to outright blocks, and the crawl-to-referral ratios reveal the underlying tension: OpenAI's crawlers access approximately1,700 pages for every referral they return to publishers; Anthropic's ratio exceeds 73,000 to 1.
Patent databases, scientific publishers, and IP analytics platforms are among the most restrictive content categories. A Duke University study in 2025 found that several categories of AI-related crawlers never request robots.txt files at all. The practical consequence is that the knowledge gap between what a general-purpose model "knows" about the patent landscape and what actually exists in the patent record is widening with each training cycle. A landscape query that a general-purpose model partially answered in 2023 may return less useful information in 2026.
3.3 General-Purpose Models Lack Ontological Frameworks for Patent Analysis
A freedom-to-operate analysis is not a summarization task. It requires understanding claim scope, prosecution history, continuation and divisional chains, assignee normalization (a single company may appear under multiple entity names across patent records), priority dates versus filing dates versus publication dates, and the relationship between dependent and independent claims. It requires mapping the specific technical features of a proposed product against independent claim language—not keyword matching.
General-purpose models do not have these frameworks. They pattern-match against training data and produce outputs that adopt the format and tone of patent analysis without the underlying data infrastructure. The format is correct. The confidence is high. The coverage is incomplete in ways that are not visible to the user.
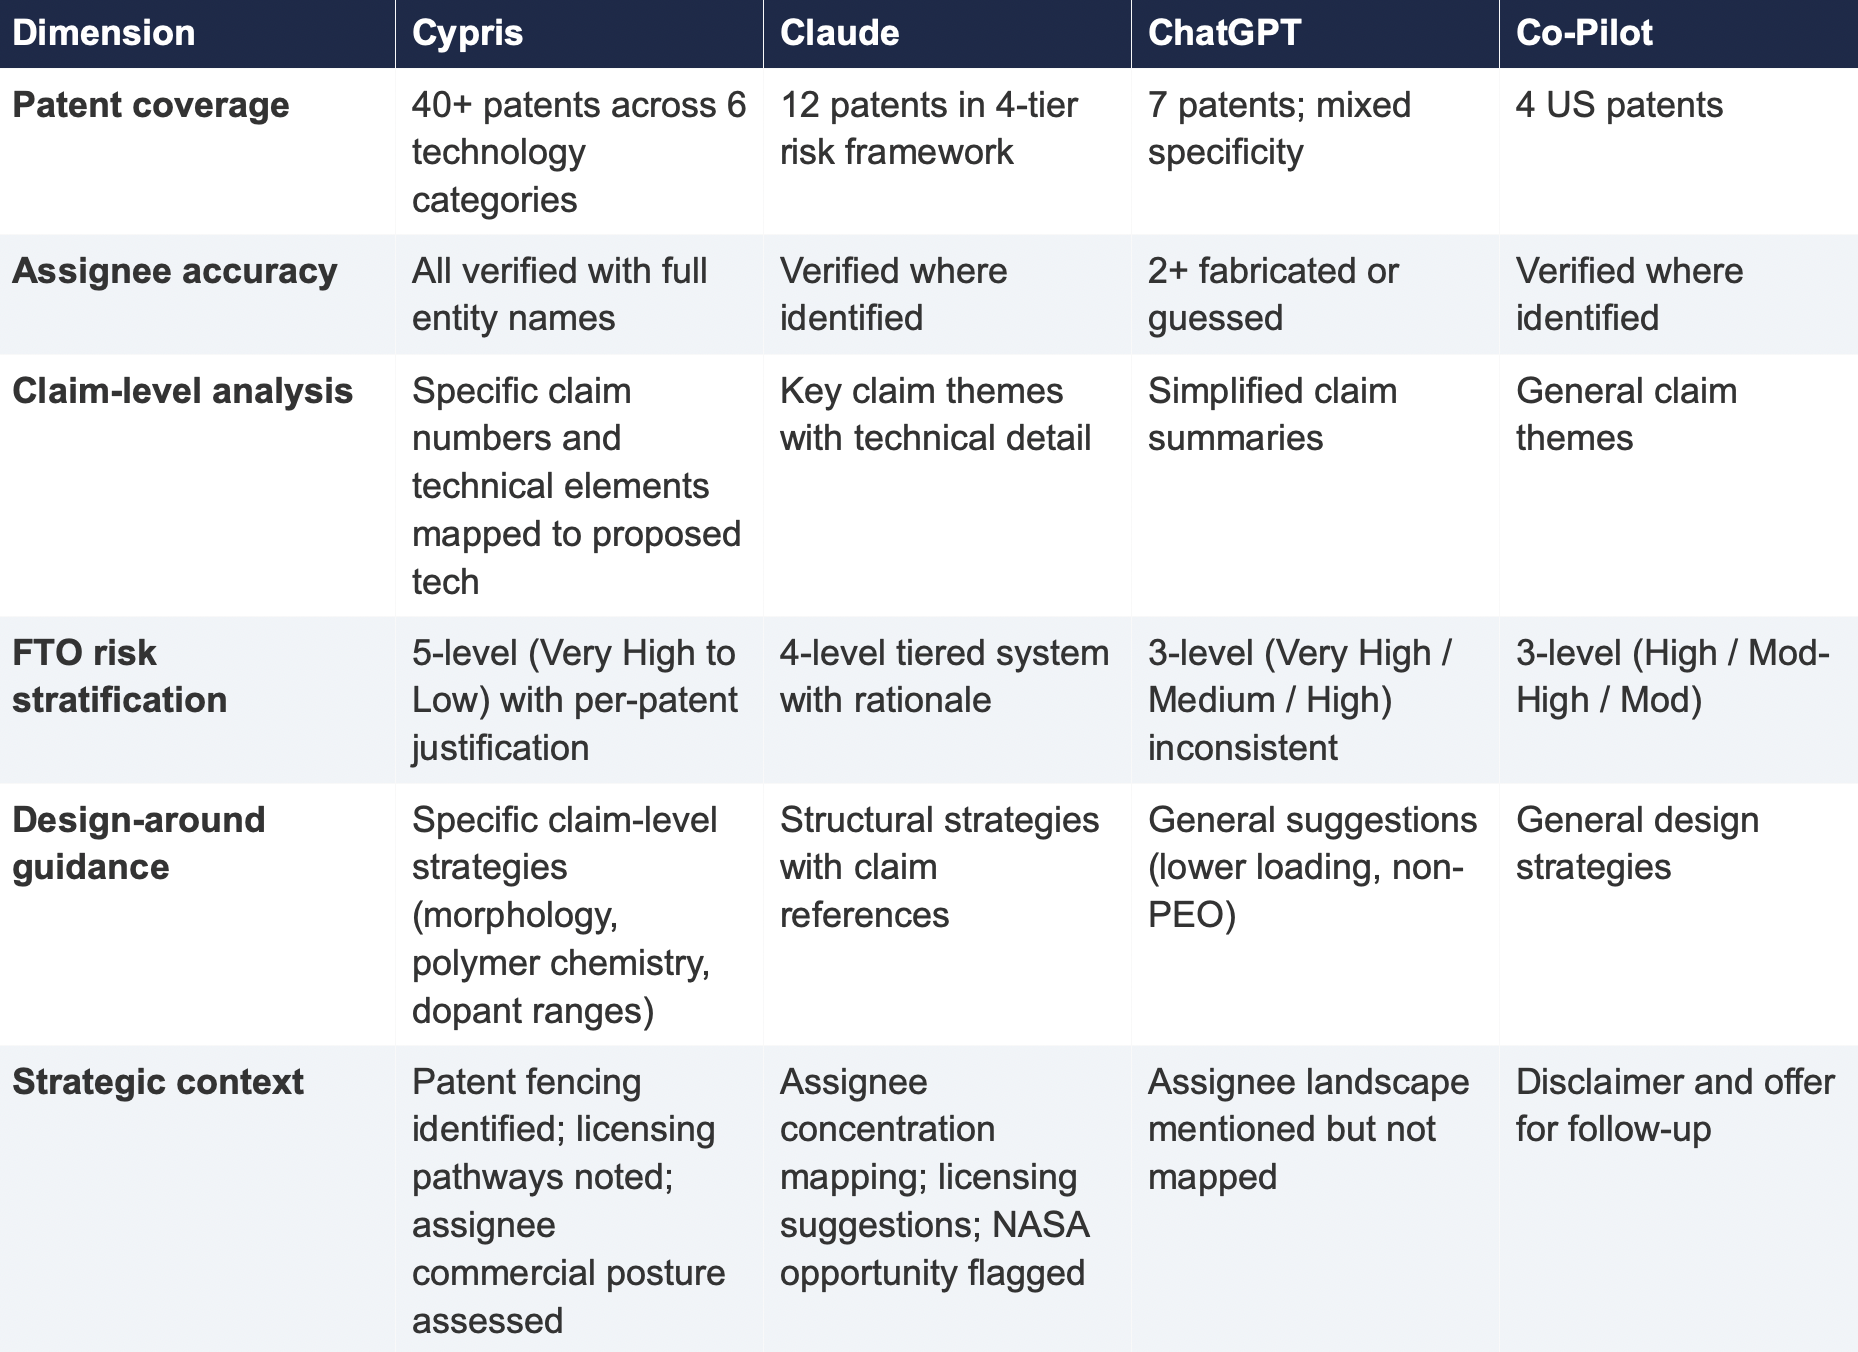
4. Comparative Output Quality
The following table summarizes the qualitative characteristics of each tool's response across the dimensions most relevant to an operational IP workflow.
5. Implications for R&D and IP Organizations
5.1 The Confidence Problem
The central risk identified by this study is not that general-purpose models produce bad outputs—it is that they produce incomplete outputs with high confidence. Each model delivered its results in a professional format with structured analysis, risk ratings, and strategic recommendations. At no point did any model indicate the boundaries of its knowledge or flag that its results represented a fraction of the available patent record. A practitioner receiving one of these outputs would have no signal that the analysis was incomplete unless they independently validated it against a comprehensive datasource.
This creates an asymmetric risk profile: the better the format and tone of the output, the less likely the user is to question its completeness. In a corporate environment where AI outputs are increasingly treated as first-pass analysis, this dynamic incentivizes under-investigation at precisely the moment when thoroughness is most critical.
5.2 The Diversification Illusion
It might be assumed that running the same query through multiple general-purpose models provides validation through diversity of sources. This study suggests otherwise. While the four tools returned different subsets of patents, all operated under the same structural constraints: training data rather than live patent databases, web-scraped content rather than structured IP records, and general-purpose reasoning rather than patent-specific ontological frameworks. Running the same query through three constrained tools does not produce triangulation; it produces three partial views of the same incomplete picture.
5.3 The Appropriate Use Boundary
General-purpose language models are effective tools for a wide range of tasks: drafting communications, summarizing documents, generating code, and exploratory research. The finding of this study is not that these tools lack value but that their value boundary does not extend to decisions that carry existential commercial risk.
Patent landscape analysis, freedom-to-operate assessment, and competitive intelligence that informs R&D investment decisions fall outside that boundary. These are workflows where the completeness and verifiability of the underlying data are not merely desirable but are the primary determinant of whether the analysis has value. A patent landscape that captures 10% of the relevant filings, regardless of how well-formatted or confidently presented, is a liability rather than an asset.
6. Test 2: Competitive Intelligence — Bio-Based Polyamide Patent Landscape
To assess whether the findings from Test 1 were specific to a single technology domain or reflected a broader structural pattern, a second query was submitted to all four tools. This query shifted from freedom-to-operate analysis to competitive intelligence, asking each tool to identify the top 10organizations by patent filing volume in bio-based polyamide synthesis from castor oil derivatives over the past three years, with summaries of technical approach, co-assignee relationships, and portfolio trajectory.
6.1 Query

6.2 Summary of Results
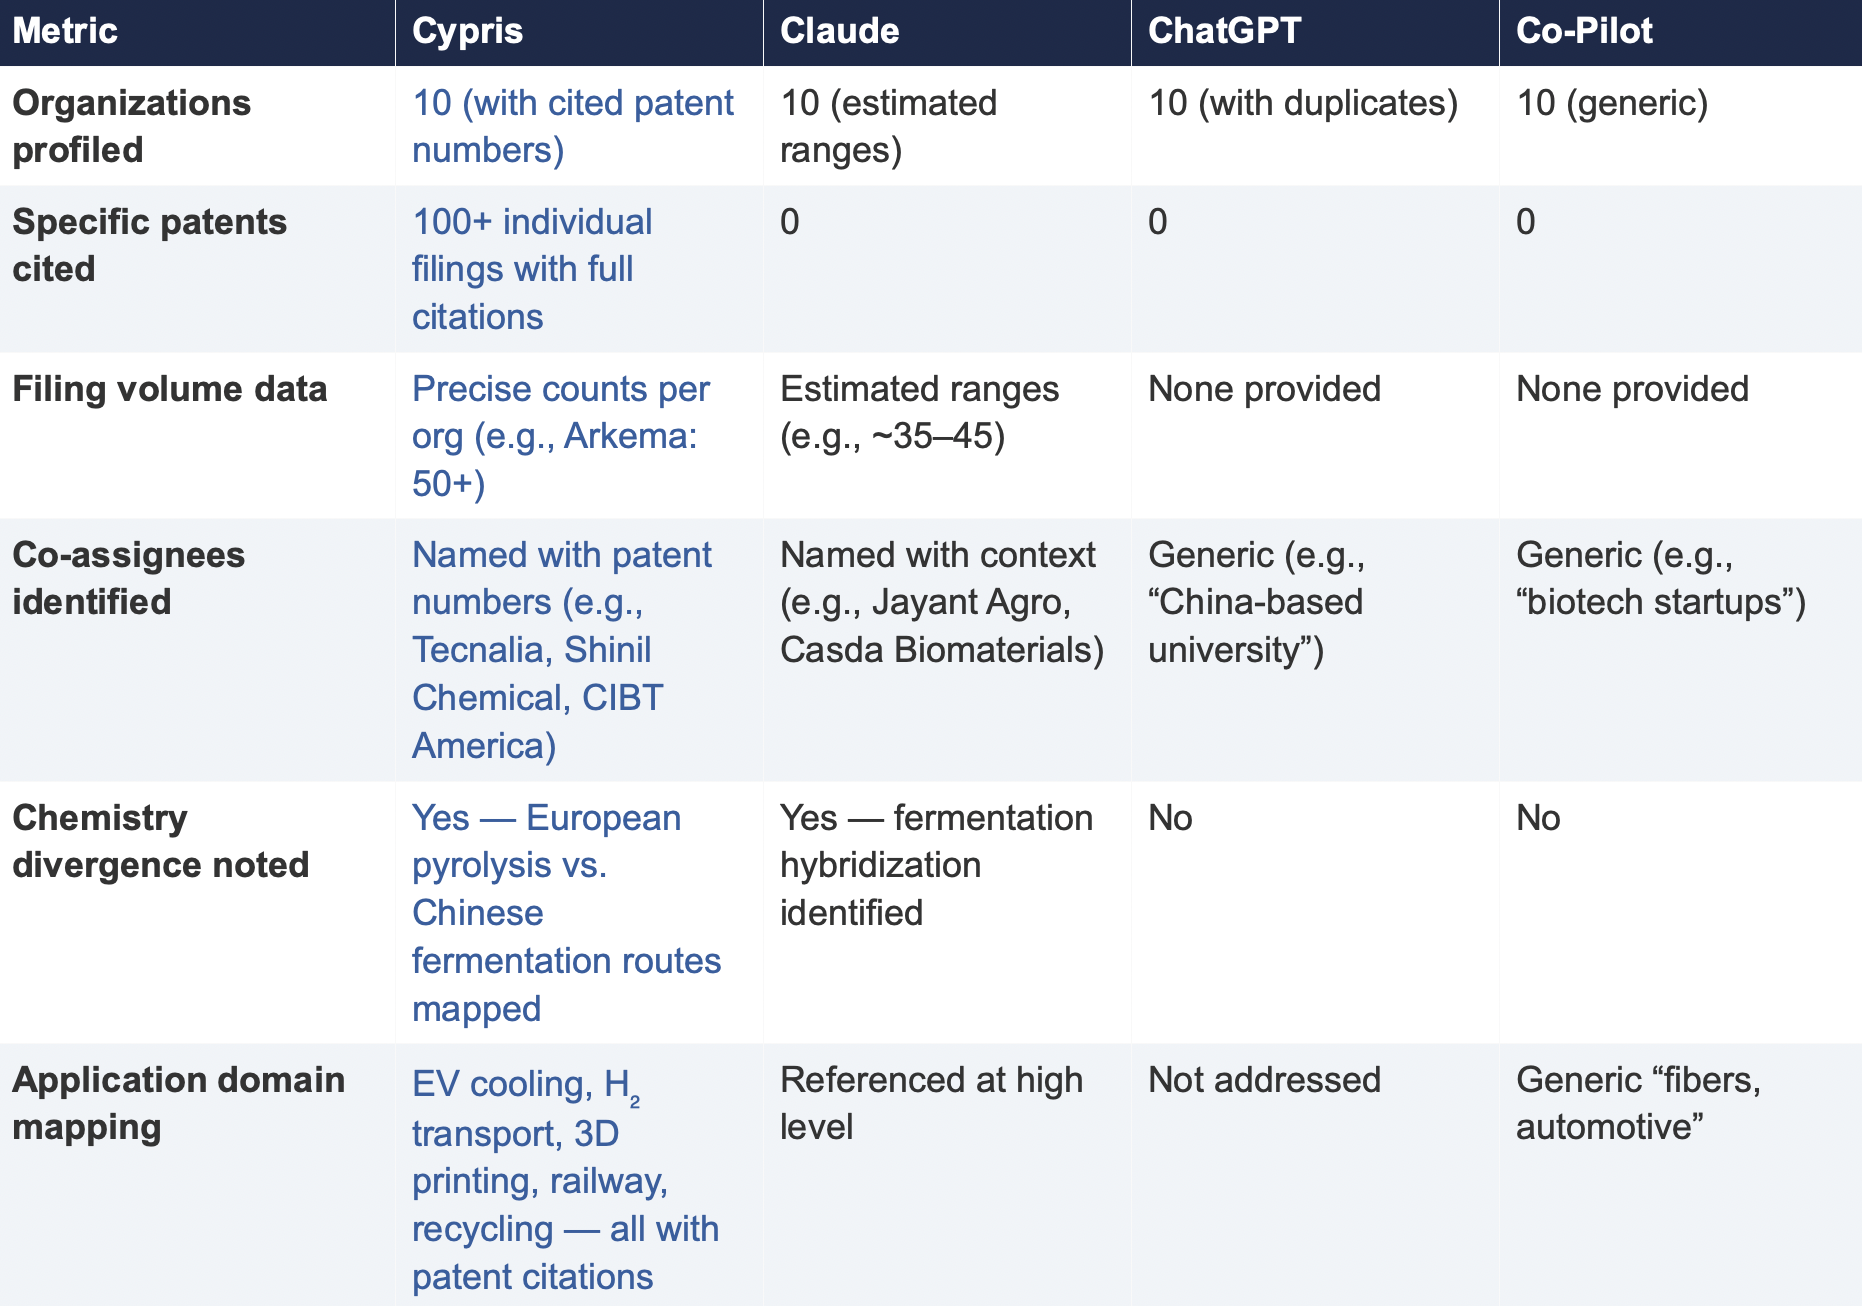
6.3 Key Differentiators
Verifiability
The most consequential difference in Test 2 was the presence or absence of verifiable evidence. Cypris cited over 100 individual patent filings with full patent numbers, assignee names, and publication dates. Every claim about an organization’s technical focus, co-assignee relationships, and filing trajectory was anchored to specific documents that a practitioner could independently verify in USPTO, Espacenet, or WIPO PATENT SCOPE. No general-purpose model cited a single patent number. Claude produced the most structured and analytically useful output among the public models, with estimated filing ranges, product names, and strategic observations that were directionally plausible. However, without underlying patent citations, every claim in the response requires independent verification before it can inform a business decision. ChatGPT and Co-Pilot offered thinner profiles with no filing counts and no patent-level specificity.
Data Integrity
ChatGPT’s response contained a structural error that would mislead a practitioner: it listed CathayBiotech as organization #5 and then listed “Cathay Affiliate Cluster” as a separate organization at #9, effectively double-counting a single entity. It repeated this pattern with Toray at #4 and “Toray(Additional Programs)” at #10. In a competitive intelligence context where the ranking itself is the deliverable, this kind of error distorts the landscape and could lead to misallocation of competitive monitoring resources.
Organizations Missed
Cypris identified Kingfa Sci. & Tech. (8–10 filings with a differentiated furan diacid-based polyamide platform) and Zhejiang NHU (4–6 filings focused on continuous polymerization process technology)as emerging players that no general-purpose model surfaced. Both represent potential competitive threats or partnership opportunities that would be invisible to a team relying on public AI tools.Conversely, ChatGPT included organizations such as ANTA and Jiangsu Taiji that appear to be downstream users rather than significant patent filers in synthesis, suggesting the model was conflating commercial activity with IP activity.
Strategic Depth
Cypris’s cross-cutting observations identified a fundamental chemistry divergence in the landscape:European incumbents (Arkema, Evonik, EMS) rely on traditional castor oil pyrolysis to 11-aminoundecanoic acid or sebacic acid, while Chinese entrants (Cathay Biotech, Kingfa) are developing alternative bio-based routes through fermentation and furandicarboxylic acid chemistry.This represents a potential long-term disruption to the castor oil supply chain dependency thatWestern players have built their IP strategies around. Claude identified a similar theme at a higher level of abstraction. Neither ChatGPT nor Co-Pilot noted the divergence.
6.4 Test 2 Conclusion
Test 2 confirms that the coverage and verifiability gaps observed in Test 1 are not domain-specific.In a competitive intelligence context—where the deliverable is a ranked landscape of organizationalIP activity—the same structural limitations apply. General-purpose models can produce plausible-looking top-10 lists with reasonable organizational names, but they cannot anchor those lists to verifiable patent data, they cannot provide precise filing volumes, and they cannot identify emerging players whose patent activity is visible in structured databases but absent from the web-scraped content that general-purpose models rely on.
7. Conclusion
This comparative analysis, spanning two distinct technology domains and two distinct analytical workflows—freedom-to-operate assessment and competitive intelligence—demonstrates that the gap between purpose-built R&D intelligence platforms and general-purpose language models is not marginal, not domain-specific, and not transient. It is structural and consequential.
In Test 1 (LLZO garnet electrolytes for Li-S batteries), the purpose-built platform identified more than three times as many patents as the best-performing general-purpose model and ten times as many as the lowest-performing one. Among the patents identified exclusively by the purpose-built platform were filings rated as Very High FTO risk that directly claim the proposed technology architecture. InTest 2 (bio-based polyamide competitive landscape), the purpose-built platform cited over 100individual patent filings to substantiate its organizational rankings; no general-purpose model cited as ingle patent number.
The structural drivers of this gap—reliance on training data rather than live patent feeds, the accelerating closure of web content to AI scrapers, and the absence of patent-specific analytical frameworks—are not transient. They are inherent to the architecture of general-purpose models and will persist regardless of increases in model capability or training data volume.
For R&D and IP leaders, the practical implication is clear: general-purpose AI tools should be used for general-purpose tasks. Patent intelligence, competitive landscaping, and freedom-to-operate analysis require purpose-built systems with direct access to structured patent data, domain-specific analytical frameworks, and the ability to surface what a general-purpose model cannot—not because it chooses not to, but because it structurally cannot access the data.
The question for every organization making R&D investment decisions today is whether the tools informing those decisions have access to the evidence base those decisions require. This study suggests that for the majority of general-purpose AI tools currently in use, the answer is no.
About This Report
This report was produced by Cypris (IP Web, Inc.), an AI-powered R&D intelligence platform serving corporate innovation, IP, and R&D teams at organizations including NASA, Johnson & Johnson, theUS Air Force, and Los Alamos National Laboratory. Cypris aggregates over 500 million data points from patents, scientific literature, grants, corporate filings, and news to deliver structured intelligence for technology scouting, competitive analysis, and IP strategy.
The comparative tests described in this report were conducted on March 27, 2026. All outputs are preserved in their original form. Patent data cited from the Cypris reports has been verified against USPTO Patent Center and WIPO PATENT SCOPE records as of the same date. To conduct a similar analysis for your technology domain, contact info@cypris.ai or visit cypris.ai.
The Patent Intelligence Gap - A Comparative Analysis of Verticalized AI-Patent Tools vs. General-Purpose Language Models for R&D Decision-Making
Blogs

Checking a patent is an important part of the research and development process. It’s essential to ensure that your innovation or product doesn’t infringe upon existing patents, while also providing insights into potential competitors. Knowing how to check a patent can save you time, money, and resources in the long run.
This blog post will explore what exactly a patent is, how to check a patent effectively, and how to file your own application with confidence. Check out this helpful guide if you want more information about checking patents!
Table of Contents
Analyzing the Results of Your Patent Search
Reading the Results of Your Search
Identifying Potential Infringements or Conflicts
Preparing to File a Patent Application
What Happens After You File Your Patent Application?
What is a Patent?
A patent is an exclusive legal right granted by a government for an invention that provides its owner with certain protections against unauthorized use or sale of the patented item. Patents are used to protect inventions such as machines, processes, products, and even documents.
There are three main types of patents – utility patents, design patents, and plant patents – each providing different levels and types of protection for inventors’ creations.
Utility patents cover new and useful inventions such as machines, processes, or chemical compositions.
Design patents cover ornamental designs applied to articles.
Plant patents cover newly developed varieties of plants not found in nature.
Let’s take a look at how to check a patent effectively.
Don’t let your invention get stolen! Get the protection you need with a patent. #InventorLife #PatentProtection Click to Tweet
How to Check a Patent
The first step in checking a patent is to conduct a search of relevant databases such as the USPTO (United States Patent and Trademark Office) or EPO (European Patent Office). This will help you identify any existing patents related to your project.
The USPTO offers free access to its database through its website, while EPO provides access through its Espacenet platform.
Additionally, many private companies offer paid services that provide more comprehensive searches of multiple databases at once.
When conducting a search of existing patents, it is important to use keywords that accurately describe your project or invention so that you do not miss any potentially relevant results.
Once you have identified relevant patents, it’s important to read them carefully so that you can understand their scope and determine if there are any potential conflicts with your work. Pay attention not only to what is explicitly stated but also implied language.
Finally, remember that searching multiple databases can often yield different results and it is best practice to check all applicable sources.
Key Takeaway: When checking a patent, it is important to conduct a thorough search of relevant databases such as the USPTO and EPO. Remember to check multiple databases before making any decisions about potential conflicts with another inventor’s patent rights.
Analyzing the Results of Your Patent Search
Analyzing the results of your patent search is an important step in ensuring that you are able to protect your invention and secure a valid patent.
Reading the Results of Your Search
A successful search will reveal any prior art related to similar inventions as well as any pending applications for similar inventions. This information can help you determine whether there are already existing patents on similar ideas or products, which could prevent you from obtaining a valid patent for yours.
Identifying Potential Infringements or Conflicts
Once you have identified any potential conflicts between your invention and existing patents, it’s important to review each one carefully to ensure that there are no infringing elements present in either party’s product or process. If there are similarities between two products or processes, it may be necessary to modify one so that it does not infringe upon another’s rights.
Assessing Your Invention
After identifying any potential conflicts with other patents, assess how strong and valid your own invention is before filing a patent application. Consider factors such as novelty (how unique is this idea?), usefulness (does this solve an existing problem?), and non-obviousness (is this something someone else would think of?).
If there are no conflicts or infringements, then it’s time to prepare for filing a patent application.

(Source)
Preparing to File a Patent Application
Before filing a patent application, it is important to ensure that you have all the necessary documentation and information. This includes details about your invention, such as drawings or diagrams, descriptions of how it works, and any other relevant materials.
Make sure that you have conducted a thorough patent search to check for existing patents that may conflict with yours.
Choosing an attorney or agent to represent you in filing your application is essential. Find someone who has experience in patent law and can provide advice on the best way forward with your application. Make sure they are familiar with the specific jurisdiction where you plan to file your application so they can help guide you through the process.
Finally, determine which jurisdiction is best for filing your patent application. Different countries have different laws regarding patents and intellectual property rights so it is important to understand these before making a decision on where to file your application.
Factors such as filing fees, duration of protection, and whether there are any restrictions on what types of inventions can be patented should all be taken into consideration when deciding where to file your patent.
Ready to file a patent? Don’t forget the 3 Ps: paperwork, patent search, and picking an attorney! With Cypris’ research platform, you can make sure your invention is ready for filing in the right jurisdiction. #PatentFiling #Innovation Click to Tweet
What Happens After You File Your Patent Application?
After you file your patent application, the process of obtaining a patent begins.
The United States Patent and Trademark Office (USPTO) will review your application to determine if it meets all requirements for granting a patent. If any issues are identified during the review process, they will be communicated in an office action from the USPTO. It is important to respond promptly and accurately to these actions as failure to do so can result in abandonment of your application.
Responding to office actions from the USPTO requires careful consideration and analysis of each issue raised by the examiner. Depending on what is requested, you may need additional evidence or argumentation in order to satisfy their concerns. Consult with an attorney when responding to office actions before submitting a response.
Monitoring other applications that may conflict with yours is also essential after filing your patent application. This includes searching for prior submissions that could potentially invalidate some or all of your claims, as well as keeping track of similar applications filed by competitors.
Don’t let your patent application get stuck in the USPTO review process! Keep an eye out for office actions and potential conflicts with other applications. #PatentProtection Click to Tweet
Conclusion
It helps to ensure that you are not infringing on any existing patents and can provide valuable insight into what your invention should look like. By understanding the basics of how to check a patent, analyzing the results of your search, preparing to file a patent application, and knowing what comes after, you will be well-prepared when it comes to checking a patent.
Are you looking for a way to quickly and efficiently check patents? Cypris is the answer! Our research platform was designed specifically with R&D and innovation teams in mind.
With our easy-to-use interface, we centralize all of your data sources into one place so that you can get quick insights without having to waste time searching through various databases. Get started today with Cypris – it’s the best solution for checking patents!
Patents are an important part of any successful research and innovation program, but they can also come with a hefty price tag. Patent maintenance fees must be paid periodically in order to keep them valid. But how much are patent maintenance fees?In this blog post, we’ll explore the basics of patent maintenance fees, including how much are patent maintenance fees, who is responsible for paying them, and what happens if you don’t pay your fee on time or at all.Let’s find out exactly how much patent maintenance fees may set you back!
Table of Contents
What are Patent Maintenance Fees?
How Much Are Patent Maintenance Fees?
When Are Patent Maintenance Fees Due?
Who is Responsible for Paying the Patent Maintenance Fee?
What Happens if You Don’t Pay Your Patent Maintenance Fee?
FAQs About How Much Are Patent Maintenance Fees
How often do you pay patent maintenance fees?
How much does it cost to renew a US patent?
What are Patent Maintenance Fees?
Patent maintenance fees are charges that must be paid to keep a patent valid. These fees are necessary because patents have limited lifespans and need to be renewed periodically in order for the patent holder to maintain their exclusive rights over an invention.There are three main types of patent maintenance fees: annuity payments, renewal fees, and re-examination fees.Annuity payments are due at regular intervals throughout the life of the patent and typically cover costs associated with maintaining the patent’s validity such as legal services, administrative costs, etc.Renewal fees are due when a patent is up for renewal after its initial term has expired. These can range from small amounts to large sums depending on how long ago the original application was filed.Re-examination fees may also be required if there is evidence that a previously granted claim should not have been allowed or if new prior art has been discovered which could invalidate existing claims.Patent maintenance fees are an important part of protecting your invention. Knowing the costs associated with patent maintenance can help you plan and budget accordingly. Now let’s take a look at how much these fees typically cost.
Patent maintenance fees: just like taxes, they’re unavoidable! Keep your inventions and products safe by staying on top of those pesky fees. #innovation #patents Click to Tweet
How Much Are Patent Maintenance Fees?
The average cost for a basic utility patent in the United States is around $1,000 per year after filing fees have been paid.In Europe, however, this number can range anywhere from €500 to €2,000 per year depending on where you file your application and the length and complexity of your invention’s description.There are several factors that affect how much are patent maintenance fees. These include the type and complexity of the invention being patented, as well as any additional costs associated with maintaining or defending a patent. Different countries have different laws regarding patents and their associated costs, which can also affect how much you pay for your patent maintenance fee.One way to reduce patent maintenance costs is by using Cypris’ research platform for R&D teams. This software helps streamline processes related to researching prior art and relevant regulations — saving time and money when dealing with costly renewal fees.Additionally, there are strategies such as limiting claims made within an application or negotiating payment plans directly with local offices that may help reduce overall costs.Next, let’s explore when these fees are due.

(Source)
When Are Patent Maintenance Fees Due?
Patent maintenance fees are due at regular intervals throughout the life of a patent. Depending on the country, these fees may be due annually or every few years. The timing for payment of these fees is typically specified in the patent application and can vary from one jurisdiction to another.In most countries, patent maintenance fees must be paid within six months prior to their expiration date. Failure to pay before this deadline will result in the patent lapsing and becoming invalidated, which means that it no longer offers any legal protection for its owner’s invention or product.Late payment penalties may also apply if a fee is not paid on time. These penalties can range from additional costs to complete revocation of the patent rights granted by the original application. In some cases, late payments may even render an invention unpatentable as well as void any existing patents associated with it.It is important to note that different jurisdictions have different regulations regarding when and how much a fee must be paid in order for a patent to remain valid and enforceable. Therefore, it is essential that R&D teams stay up-to-date with all relevant laws and regulations pertaining to their particular jurisdiction so they do not miss out on critical deadlines or incur unnecessary expenses related to late payments of such fees.It is important to understand when patent maintenance fees are due and who is responsible for paying them in order to maintain your patents. In the next section, we will discuss who is liable for payment of these fees and the differences between joint owners and assignees.
Don’t let your patent expire! Pay those maintenance fees on time or you’ll be paying more than just the cost of doing business. #PatentProtection #RDInnovation Click to Tweet
Who is Responsible for Paying the Patent Maintenance Fee?
Generally, the patent owner is responsible for paying all maintenance fees associated with a patent. The patent owner can be an individual or a company, and they are liable for payment regardless of who filed the application.In some cases, multiple parties may have ownership rights to a single patent. In these instances, each party is jointly liable for payment of any applicable fees.When two or more people own a single patent, it is important to understand how responsibility will be divided between them when it comes to paying maintenance fees. Generally speaking, joint owners must agree on which party will pay the fee before submitting their payment.If no agreement can be reached, then all parties must contribute equally toward its cost. If one party assigns their rights in relation to the patent, they remain responsible for any outstanding payments until such time as those payments are made by either themselves or another assignee.
Don’t let patent maintenance fees sneak up on you! Joint owners must agree on who pays the fee or split it equally. Keep your patents in check and stay ahead of the game! #PatentMaintenanceFees Click to Tweet
What Happens if You Don’t Pay Your Patent Maintenance Fee?
Failing to pay patent maintenance fees on time can have serious consequences. If a fee is not paid within the designated timeframe, the patent will be deemed abandoned and no longer valid. This means that any rights or protection associated with the patent are also lost.The consequences of not paying your fees on time include:
- Loss of Patent Rights: Once a patent has been declared abandoned, all rights associated with it are forfeited and anyone may use the invention without permission from the original inventor.
- Legal Liability: The inventor may be held liable for damages if someone else uses their invention after it has been declared abandoned.
- Financial Losses: Not only does an inventor lose out on potential profits from licensing their invention but they also incur additional costs in trying to regain their rights by filing a new application or reinstating an existing one.
FAQs About How Much Are Patent Maintenance Fees
How often do you pay patent maintenance fees?
You may pay without a surcharge for 3 to 3.5 years, 7 to 7.5 years, and 11 to 11.5 years after the date of issue.You cannot pay early.You may also pay with a surcharge during the grace periods at 3.5 to 4 years, 7.5 to 8 years, and 11.5 to 12 years after the date of issue.
How much does it cost to renew a US patent?
The cost to renew a US patent depends on the type of patent. Generally, for utility patents, the renewal fee is $800. For design patents, the renewal fee is $200.There may be additional fees associated with late payments or other special circumstances.
Conclusion
Being aware of how much are patent maintenance fees and when they are due is an important part of protecting your intellectual property. It’s also essential to know who is responsible for paying these fees so you don’t miss any payments that could result in losing your patent rights.Are you looking for a reliable and cost-effective way to manage your patent maintenance fees? Look no further than Cypris. Our research platform provides the data sources teams need in one easy-to-use, intuitive interface, giving you quick access to insights on how much are patent maintenance fees. With our help, managing these costs is easier than ever before!

Reports
%20-%20Competitive%20Benchmarking%20for%20Industrial%20Robotics%20OEMs.png)
%20-%20Competitive%20Benchmarking%20of%20EV%20Battery%20Material%20%26%20Cell%20Manufacturers.png)
%20-%20Competitive%20Benchmarking%20for%20Wearable%20%26%20Biosensor%20Device%20Manufacturers.png)
Webinars
.png)

Most IP organizations are making high-stakes capital allocation decisions with incomplete visibility – relying primarily on patent data as a proxy for innovation. That approach is not optimal. Patents alone cannot reveal technology trajectories, capital flows, or commercial viability.
A more effective model requires integrating patents with scientific literature, grant funding, market activity, and competitive intelligence. This means that for a complete picture, IP and R&D teams need infrastructure that connects fragmented data into a unified, decision-ready intelligence layer.
AI is accelerating that shift. The value is no longer simply in retrieving documents faster; it’s in extracting signal from noise. Modern AI systems can contextualize disparate datasets, identify patterns, and generate strategic narratives – transforming raw information into actionable insight.
Join us on Thursday, April 23, at 12 PM ET for a discussion on how unified AI platforms are redefining decision-making across IP and R&D teams. Moderated by Gene Quinn, panelists Marlene Valderrama and Amir Achourie will examine how integrating technical, scientific, and market data collapses traditional silos – enabling more aligned strategy, sharper investment decisions, and measurable business impact.
Register here: https://ipwatchdog.com/cypris-april-23-2026/
.png)
In this session, we break down how AI is reshaping the R&D lifecycle, from faster discovery to more informed decision-making. See how an intelligence layer approach enables teams to move beyond fragmented tools toward a unified, scalable system for innovation.
In this session, we explore how modern AI systems are reshaping knowledge management in R&D. From structuring internal data to unlocking external intelligence, see how leading teams are building scalable foundations that improve collaboration, efficiency, and long-term innovation outcomes.
.avif)