
Insights on Innovation, R&D, and IP
Perspectives on patents, scientific research, emerging technologies, and the strategies shaping modern R&D

Executive Summary
In 2024, US patent infringement jury verdicts totaled $4.19 billion across 72 cases. Twelve individual verdicts exceeded $100million. The largest single award—$857 million in General Access Solutions v.Cellco Partnership (Verizon)—exceeded the annual R&D budget of many mid-market technology companies. In the first half of 2025 alone, total damages reached an additional $1.91 billion.
The consequences of incomplete patent intelligence are not abstract. In what has become one of the most instructive IP disputes in recent history, Masimo’s pulse oximetry patents triggered a US import ban on certain Apple Watch models, forcing Apple to disable its blood oxygen feature across an entire product line, halt domestic sales of affected models, invest in a hardware redesign, and ultimately face a $634 million jury verdict in November 2025. Apple—a company with one of the most sophisticated intellectual property organizations on earth—spent years in litigation over technology it might have designed around during development.
For organizations with fewer resources than Apple, the risk calculus is starker. A mid-size materials company, a university spinout, or a defense contractor developing next-generation battery technology cannot absorb a nine-figure verdict or a multi-year injunction. For these organizations, the patent landscape analysis conducted during the development phase is the primary risk mitigation mechanism. The quality of that analysis is not a matter of convenience. It is a matter of survival.
And yet, a growing number of R&D and IP teams are conducting that analysis using general-purpose AI tools—ChatGPT, Claude, Microsoft Co-Pilot—that were never designed for patent intelligence and are structurally incapable of delivering it.
This report presents the findings of a controlled comparison study in which identical patent landscape queries were submitted to four AI-powered tools: Cypris (a purpose-built R&D intelligence platform),ChatGPT (OpenAI), Claude (Anthropic), and Microsoft Co-Pilot. Two technology domains were tested: solid-state lithium-sulfur battery electrolytes using garnet-type LLZO ceramic materials (freedom-to-operate analysis), and bio-based polyamide synthesis from castor oil derivatives (competitive intelligence).
The results reveal a significant and structurally persistent gap. In Test 1, Cypris identified over 40 active US patents and published applications with granular FTO risk assessments. Claude identified 12. ChatGPT identified 7, several with fabricated attribution. Co-Pilot identified 4. Among the patents surfaced exclusively by Cypris were filings rated as “Very High” FTO risk that directly claim the technology architecture described in the query. In Test 2, Cypris cited over 100 individual patent filings with full attribution to substantiate its competitive landscape rankings. No general-purpose model cited a single patent number.
The most active sectors for patent enforcement—semiconductors, AI, biopharma, and advanced materials—are the same sectors where R&D teams are most likely to adopt AI tools for intelligence workflows. The findings of this report have direct implications for any organization using general-purpose AI to inform patent strategy, competitive intelligence, or R&D investment decisions.

1. Methodology
A single patent landscape query was submitted verbatim to each tool on March 27, 2026. No follow-up prompts, clarifications, or iterative refinements were provided. Each tool received one opportunity to respond, mirroring the workflow of a practitioner running an initial landscape scan.
1.1 Query
Identify all active US patents and published applications filed in the last 5 years related to solid-state lithium-sulfur battery electrolytes using garnet-type ceramic materials. For each, provide the assignee, filing date, key claims, and current legal status. Highlight any patents that could pose freedom-to-operate risks for a company developing a Li₇La₃Zr₂O₁₂(LLZO)-based composite electrolyte with a polymer interlayer.
1.2 Tools Evaluated

1.3 Evaluation Criteria
Each response was assessed across six dimensions: (1) number of relevant patents identified, (2) accuracy of assignee attribution,(3) completeness of filing metadata (dates, legal status), (4) depth of claim analysis relative to the proposed technology, (5) quality of FTO risk stratification, and (6) presence of actionable design-around or strategic guidance.
2. Findings
2.1 Coverage Gap
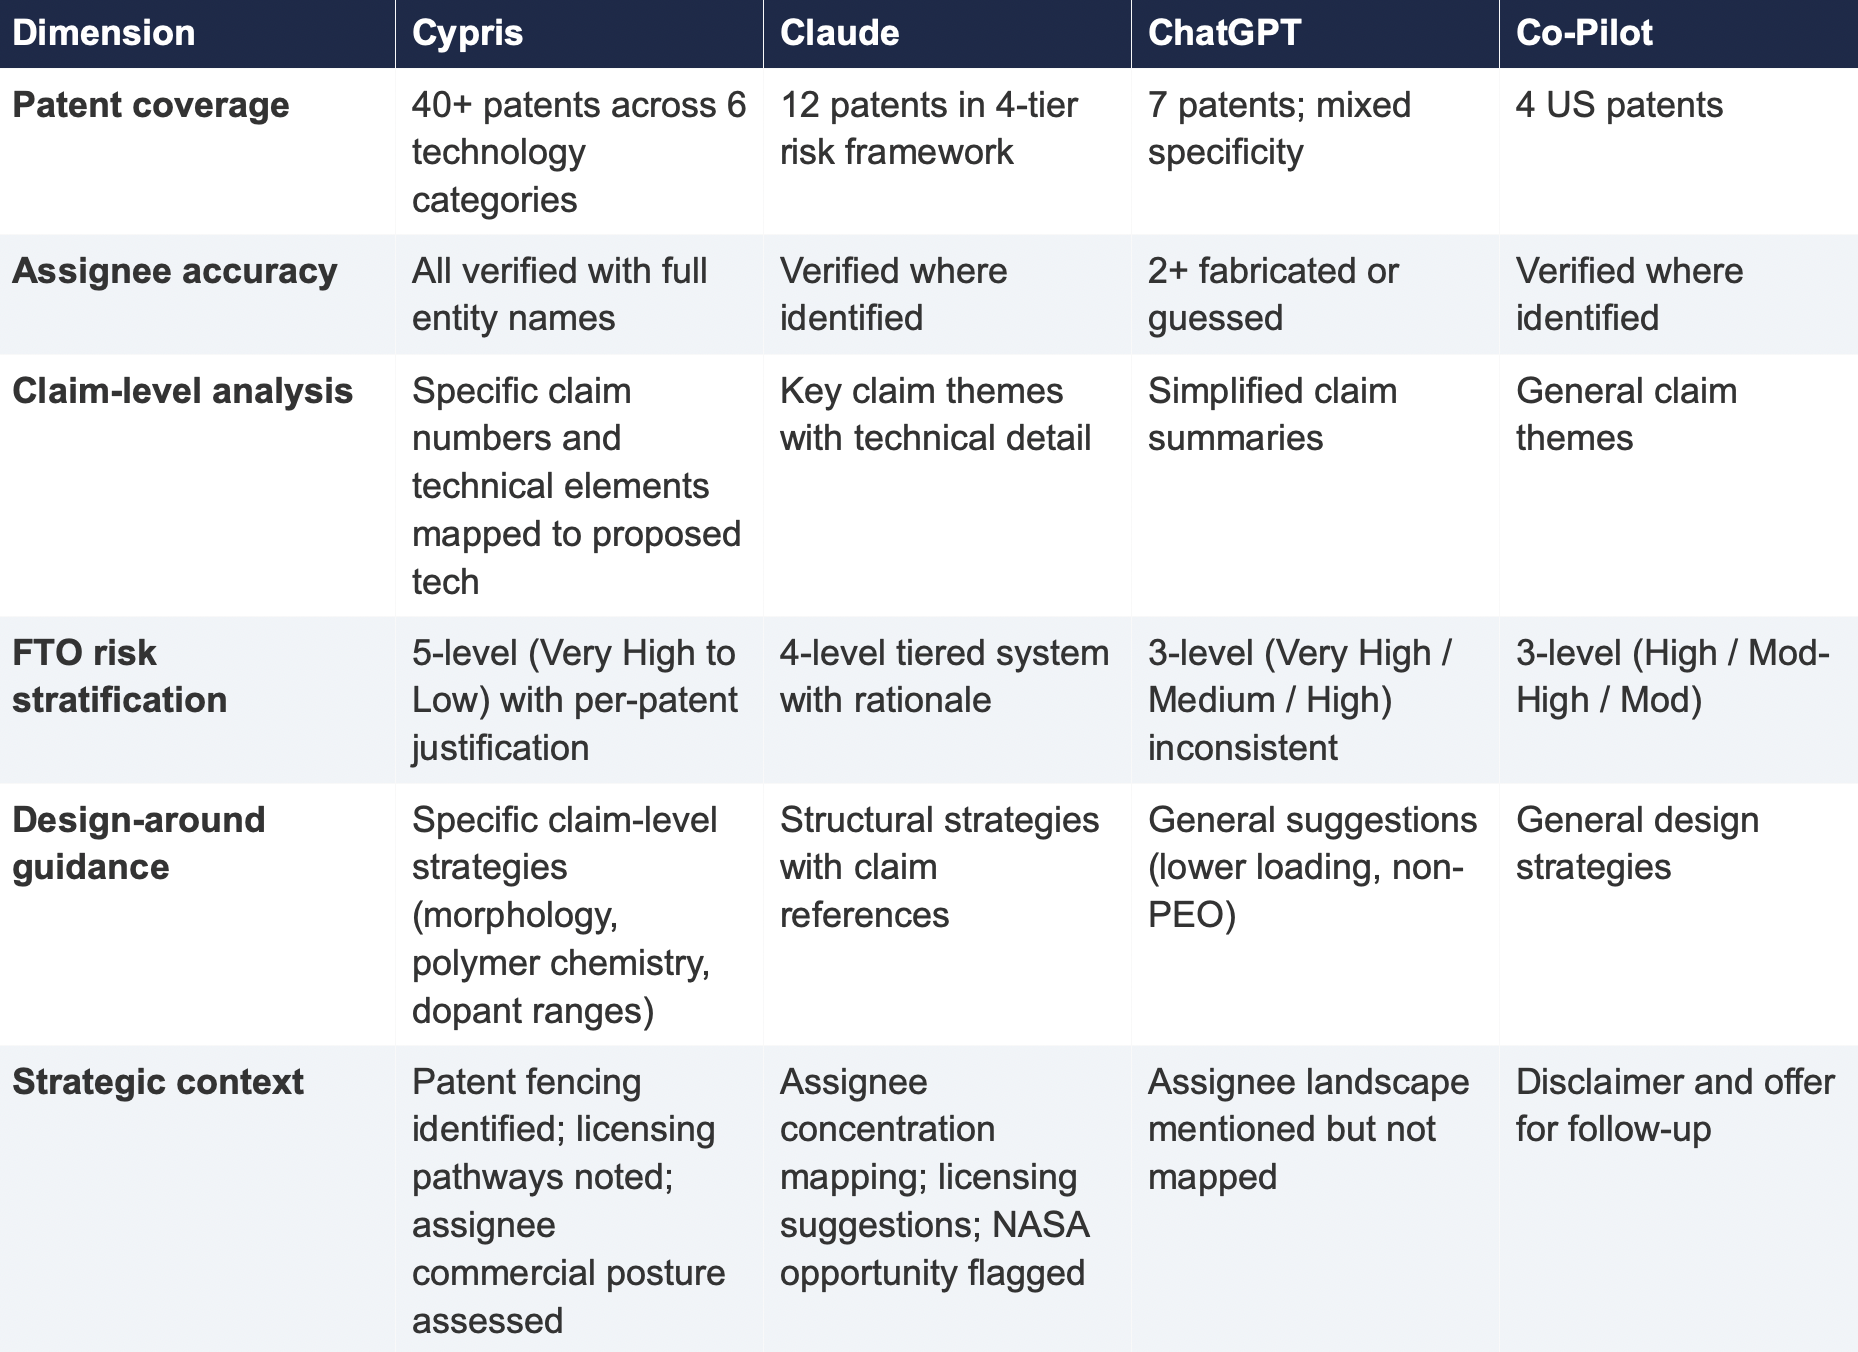
The most significant finding is the scale of the coverage differential. Cypris identified over 40 active US patents and published applications spanning LLZO-polymer composite electrolytes, garnet interface modification, polymer interlayer architectures, lithium-sulfur specific filings, and adjacent ceramic composite patents. The results were organized by technology category with per-patent FTO risk ratings.
Claude identified 12 patents organized in a four-tier risk framework. Its analysis was structurally sound and correctly flagged the two highest-risk filings (Solid Energies US 11,967,678 and the LLZO nanofiber multilayer US 11,923,501). It also identified the University ofMaryland/ Wachsman portfolio as a concentration risk and noted the NASA SABERS portfolio as a licensing opportunity. However, it missed the majority of the landscape, including the entire Corning portfolio, GM's interlayer patents, theKorea Institute of Energy Research three-layer architecture, and the HonHai/SolidEdge lithium-sulfur specific filing.
ChatGPT identified 7 patents, but the quality of attribution was inconsistent. It listed assignees as "Likely DOE /national lab ecosystem" and "Likely startup / defense contractor cluster" for two filings—language that indicates the model was inferring rather than retrieving assignee data. In a freedom-to-operate context, an unverified assignee attribution is functionally equivalent to no attribution, as it cannot support a licensing inquiry or risk assessment.
Co-Pilot identified 4 US patents. Its output was the most limited in scope, missing the Solid Energies portfolio entirely, theUMD/ Wachsman portfolio, Gelion/ Johnson Matthey, NASA SABERS, and all Li-S specific LLZO filings.
2.2 Critical Patents Missed by Public Models
The following table presents patents identified exclusively by Cypris that were rated as High or Very High FTO risk for the proposed technology architecture. None were surfaced by any general-purpose model.
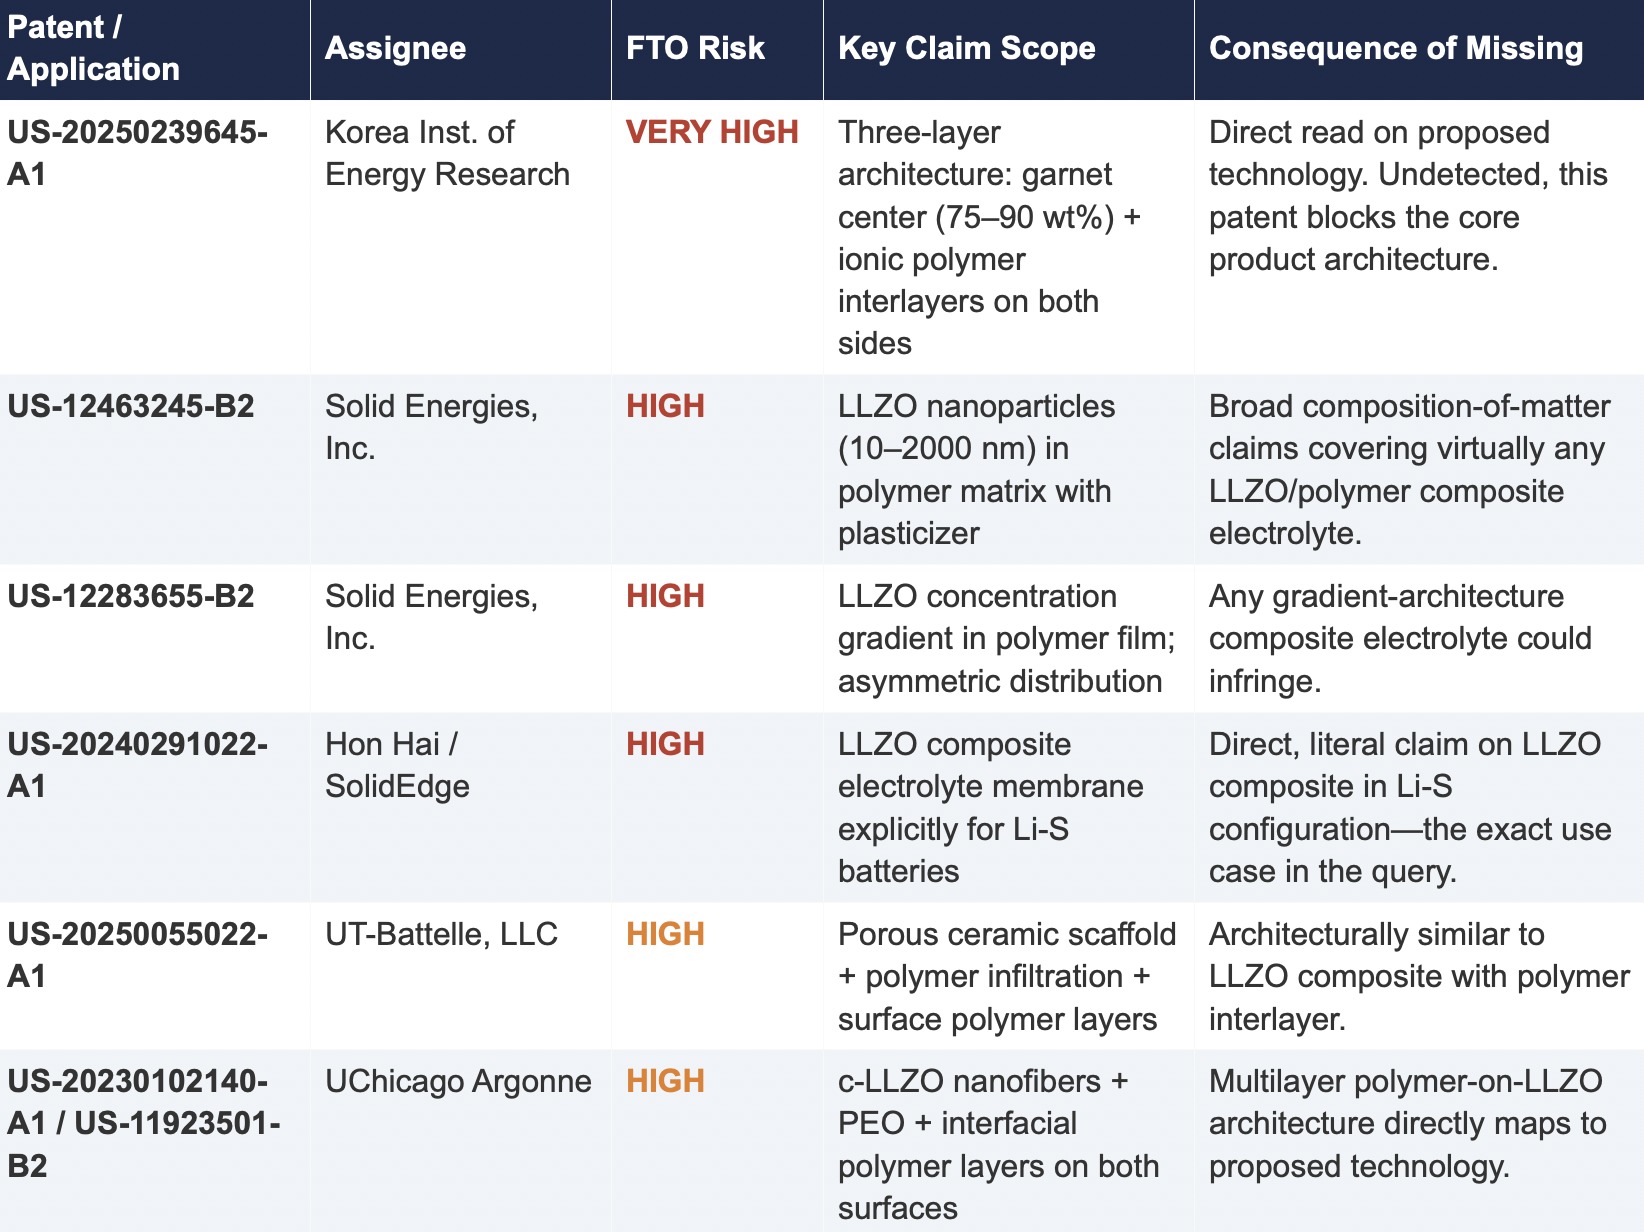
2.3 Patent Fencing: The Solid Energies Portfolio
Cypris identified a coordinated patent fencing strategy by Solid Energies, Inc. that no general-purpose model detected at scale. Solid Energies holds at least four granted US patents and one published application covering LLZO-polymer composite electrolytes across compositions(US-12463245-B2), gradient architectures (US-12283655-B2), electrode integration (US-12463249-B2), and manufacturing processes (US-20230035720-A1). Claude identified one Solid Energies patent (US 11,967,678) and correctly rated it as the highest-priority FTO concern but did not surface the broader portfolio. ChatGPT and Co-Pilot identified zero Solid Energies filings.
The practical significance is that a company relying on any individual patent hit would underestimate the scope of Solid Energies' IP position. The fencing strategy—covering the composition, the architecture, the electrode integration, and the manufacturing method—means that identifying a single design-around for one patent does not resolve the FTO exposure from the portfolio as a whole. This is the kind of strategic insight that requires seeing the full picture, which no general-purpose model delivered
2.4 Assignee Attribution Quality
ChatGPT's response included at least two instances of fabricated or unverifiable assignee attributions. For US 11,367,895 B1, the listed assignee was "Likely startup / defense contractor cluster." For US 2021/0202983 A1, the assignee was described as "Likely DOE / national lab ecosystem." In both cases, the model appears to have inferred the assignee from contextual patterns in its training data rather than retrieving the information from patent records.
In any operational IP workflow, assignee identity is foundational. It determines licensing strategy, litigation risk, and competitive positioning. A fabricated assignee is more dangerous than a missing one because it creates an illusion of completeness that discourages further investigation. An R&D team receiving this output might reasonably conclude that the landscape analysis is finished when it is not.
3. Structural Limitations of General-Purpose Models for Patent Intelligence
3.1 Training Data Is Not Patent Data
Large language models are trained on web-scraped text. Their knowledge of the patent record is derived from whatever fragments appeared in their training corpus: blog posts mentioning filings, news articles about litigation, snippets of Google Patents pages that were crawlable at the time of data collection. They do not have systematic, structured access to the USPTO database. They cannot query patent classification codes, parse claim language against a specific technology architecture, or verify whether a patent has been assigned, abandoned, or subjected to terminal disclaimer since their training data was collected.
This is not a limitation that improves with scale. A larger training corpus does not produce systematic patent coverage; it produces a larger but still arbitrary sampling of the patent record. The result is that general-purpose models will consistently surface well-known patents from heavily discussed assignees (QuantumScape, for example, appeared in most responses) while missing commercially significant filings from less publicly visible entities (Solid Energies, Korea Institute of EnergyResearch, Shenzhen Solid Advanced Materials).
3.2 The Web Is Closing to Model Scrapers
The data access problem is structural and worsening. As of mid-2025, Cloudflare reported that among the top 10,000 web domains, the majority now fully disallow AI crawlers such as GPTBot andClaudeBot via robots.txt. The trend has accelerated from partial restrictions to outright blocks, and the crawl-to-referral ratios reveal the underlying tension: OpenAI's crawlers access approximately1,700 pages for every referral they return to publishers; Anthropic's ratio exceeds 73,000 to 1.
Patent databases, scientific publishers, and IP analytics platforms are among the most restrictive content categories. A Duke University study in 2025 found that several categories of AI-related crawlers never request robots.txt files at all. The practical consequence is that the knowledge gap between what a general-purpose model "knows" about the patent landscape and what actually exists in the patent record is widening with each training cycle. A landscape query that a general-purpose model partially answered in 2023 may return less useful information in 2026.
3.3 General-Purpose Models Lack Ontological Frameworks for Patent Analysis
A freedom-to-operate analysis is not a summarization task. It requires understanding claim scope, prosecution history, continuation and divisional chains, assignee normalization (a single company may appear under multiple entity names across patent records), priority dates versus filing dates versus publication dates, and the relationship between dependent and independent claims. It requires mapping the specific technical features of a proposed product against independent claim language—not keyword matching.
General-purpose models do not have these frameworks. They pattern-match against training data and produce outputs that adopt the format and tone of patent analysis without the underlying data infrastructure. The format is correct. The confidence is high. The coverage is incomplete in ways that are not visible to the user.
4. Comparative Output Quality
The following table summarizes the qualitative characteristics of each tool's response across the dimensions most relevant to an operational IP workflow.
5. Implications for R&D and IP Organizations
5.1 The Confidence Problem
The central risk identified by this study is not that general-purpose models produce bad outputs—it is that they produce incomplete outputs with high confidence. Each model delivered its results in a professional format with structured analysis, risk ratings, and strategic recommendations. At no point did any model indicate the boundaries of its knowledge or flag that its results represented a fraction of the available patent record. A practitioner receiving one of these outputs would have no signal that the analysis was incomplete unless they independently validated it against a comprehensive datasource.
This creates an asymmetric risk profile: the better the format and tone of the output, the less likely the user is to question its completeness. In a corporate environment where AI outputs are increasingly treated as first-pass analysis, this dynamic incentivizes under-investigation at precisely the moment when thoroughness is most critical.
5.2 The Diversification Illusion
It might be assumed that running the same query through multiple general-purpose models provides validation through diversity of sources. This study suggests otherwise. While the four tools returned different subsets of patents, all operated under the same structural constraints: training data rather than live patent databases, web-scraped content rather than structured IP records, and general-purpose reasoning rather than patent-specific ontological frameworks. Running the same query through three constrained tools does not produce triangulation; it produces three partial views of the same incomplete picture.
5.3 The Appropriate Use Boundary
General-purpose language models are effective tools for a wide range of tasks: drafting communications, summarizing documents, generating code, and exploratory research. The finding of this study is not that these tools lack value but that their value boundary does not extend to decisions that carry existential commercial risk.
Patent landscape analysis, freedom-to-operate assessment, and competitive intelligence that informs R&D investment decisions fall outside that boundary. These are workflows where the completeness and verifiability of the underlying data are not merely desirable but are the primary determinant of whether the analysis has value. A patent landscape that captures 10% of the relevant filings, regardless of how well-formatted or confidently presented, is a liability rather than an asset.
6. Test 2: Competitive Intelligence — Bio-Based Polyamide Patent Landscape
To assess whether the findings from Test 1 were specific to a single technology domain or reflected a broader structural pattern, a second query was submitted to all four tools. This query shifted from freedom-to-operate analysis to competitive intelligence, asking each tool to identify the top 10organizations by patent filing volume in bio-based polyamide synthesis from castor oil derivatives over the past three years, with summaries of technical approach, co-assignee relationships, and portfolio trajectory.
6.1 Query

6.2 Summary of Results
6.3 Key Differentiators
Verifiability
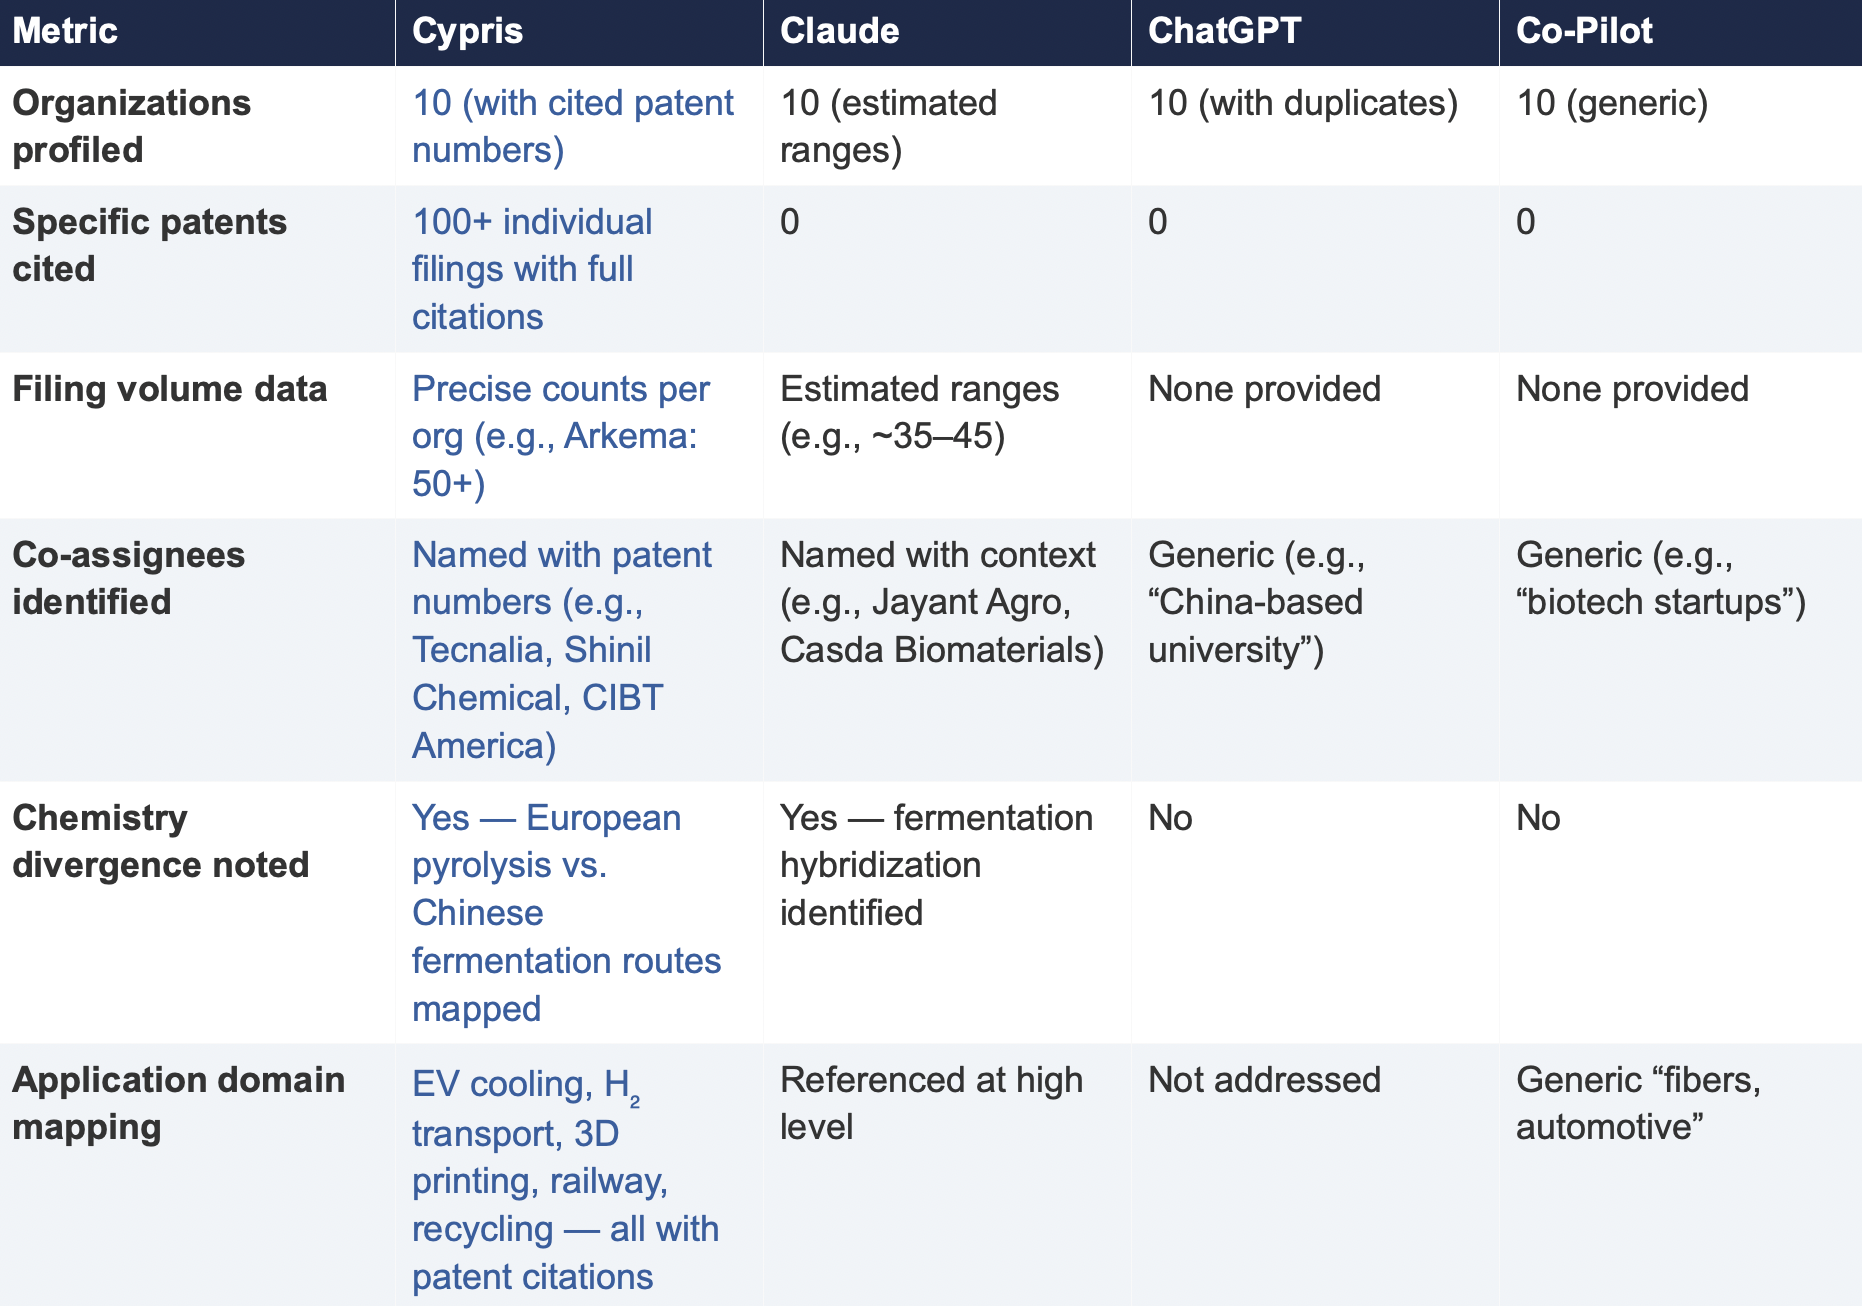
The most consequential difference in Test 2 was the presence or absence of verifiable evidence. Cypris cited over 100 individual patent filings with full patent numbers, assignee names, and publication dates. Every claim about an organization’s technical focus, co-assignee relationships, and filing trajectory was anchored to specific documents that a practitioner could independently verify in USPTO, Espacenet, or WIPO PATENT SCOPE. No general-purpose model cited a single patent number. Claude produced the most structured and analytically useful output among the public models, with estimated filing ranges, product names, and strategic observations that were directionally plausible. However, without underlying patent citations, every claim in the response requires independent verification before it can inform a business decision. ChatGPT and Co-Pilot offered thinner profiles with no filing counts and no patent-level specificity.
Data Integrity
ChatGPT’s response contained a structural error that would mislead a practitioner: it listed CathayBiotech as organization #5 and then listed “Cathay Affiliate Cluster” as a separate organization at #9, effectively double-counting a single entity. It repeated this pattern with Toray at #4 and “Toray(Additional Programs)” at #10. In a competitive intelligence context where the ranking itself is the deliverable, this kind of error distorts the landscape and could lead to misallocation of competitive monitoring resources.
Organizations Missed
Cypris identified Kingfa Sci. & Tech. (8–10 filings with a differentiated furan diacid-based polyamide platform) and Zhejiang NHU (4–6 filings focused on continuous polymerization process technology)as emerging players that no general-purpose model surfaced. Both represent potential competitive threats or partnership opportunities that would be invisible to a team relying on public AI tools.Conversely, ChatGPT included organizations such as ANTA and Jiangsu Taiji that appear to be downstream users rather than significant patent filers in synthesis, suggesting the model was conflating commercial activity with IP activity.
Strategic Depth
Cypris’s cross-cutting observations identified a fundamental chemistry divergence in the landscape:European incumbents (Arkema, Evonik, EMS) rely on traditional castor oil pyrolysis to 11-aminoundecanoic acid or sebacic acid, while Chinese entrants (Cathay Biotech, Kingfa) are developing alternative bio-based routes through fermentation and furandicarboxylic acid chemistry.This represents a potential long-term disruption to the castor oil supply chain dependency thatWestern players have built their IP strategies around. Claude identified a similar theme at a higher level of abstraction. Neither ChatGPT nor Co-Pilot noted the divergence.
6.4 Test 2 Conclusion
Test 2 confirms that the coverage and verifiability gaps observed in Test 1 are not domain-specific.In a competitive intelligence context—where the deliverable is a ranked landscape of organizationalIP activity—the same structural limitations apply. General-purpose models can produce plausible-looking top-10 lists with reasonable organizational names, but they cannot anchor those lists to verifiable patent data, they cannot provide precise filing volumes, and they cannot identify emerging players whose patent activity is visible in structured databases but absent from the web-scraped content that general-purpose models rely on.
7. Conclusion
This comparative analysis, spanning two distinct technology domains and two distinct analytical workflows—freedom-to-operate assessment and competitive intelligence—demonstrates that the gap between purpose-built R&D intelligence platforms and general-purpose language models is not marginal, not domain-specific, and not transient. It is structural and consequential.
In Test 1 (LLZO garnet electrolytes for Li-S batteries), the purpose-built platform identified more than three times as many patents as the best-performing general-purpose model and ten times as many as the lowest-performing one. Among the patents identified exclusively by the purpose-built platform were filings rated as Very High FTO risk that directly claim the proposed technology architecture. InTest 2 (bio-based polyamide competitive landscape), the purpose-built platform cited over 100individual patent filings to substantiate its organizational rankings; no general-purpose model cited as ingle patent number.
The structural drivers of this gap—reliance on training data rather than live patent feeds, the accelerating closure of web content to AI scrapers, and the absence of patent-specific analytical frameworks—are not transient. They are inherent to the architecture of general-purpose models and will persist regardless of increases in model capability or training data volume.
For R&D and IP leaders, the practical implication is clear: general-purpose AI tools should be used for general-purpose tasks. Patent intelligence, competitive landscaping, and freedom-to-operate analysis require purpose-built systems with direct access to structured patent data, domain-specific analytical frameworks, and the ability to surface what a general-purpose model cannot—not because it chooses not to, but because it structurally cannot access the data.
The question for every organization making R&D investment decisions today is whether the tools informing those decisions have access to the evidence base those decisions require. This study suggests that for the majority of general-purpose AI tools currently in use, the answer is no.
About This Report
This report was produced by Cypris (IP Web, Inc.), an AI-powered R&D intelligence platform serving corporate innovation, IP, and R&D teams at organizations including NASA, Johnson & Johnson, theUS Air Force, and Los Alamos National Laboratory. Cypris aggregates over 500 million data points from patents, scientific literature, grants, corporate filings, and news to deliver structured intelligence for technology scouting, competitive analysis, and IP strategy.
The comparative tests described in this report were conducted on March 27, 2026. All outputs are preserved in their original form. Patent data cited from the Cypris reports has been verified against USPTO Patent Center and WIPO PATENT SCOPE records as of the same date. To conduct a similar analysis for your technology domain, contact info@cypris.ai or visit cypris.ai.
The Patent Intelligence Gap - A Comparative Analysis of Verticalized AI-Patent Tools vs. General-Purpose Language Models for R&D Decision-Making
All Blogs

As businesses look to increase their competitive edge and stay ahead of the competition, investing in research and development has become essential. How does investing in R&D improve creativity?
In this blog post, we’ll explore how does investing in R&D improve creativity as well as potential challenges that need to be addressed when making such investments.
We’ll also discuss tools and technologies available for enhancing returns on investment from these projects while providing best practices for maximizing success with each endeavor.
Table of Contents
How Does Investing in R&D Improve Creativity?
The Role of Innovation in Creativity
The Impact of Investment on Creativity
Strategies for Enhancing Creativity Through R&D Investments
Tools and Technologies for R&D
FAQs About How Does Investing in R&D Improve Creativity
Why is R&D a key factor in productivity improvement?
How does R&D influence design?
What is R&D?
Research and development (R&D) is a term used to describe the activities involved in creating new products, services, or processes. It involves taking an idea from concept to market.
R&D can involve research into existing technologies and processes as well as developing entirely new ones.
There are two main types of R&D: basic research and applied research.
Basic research focuses on understanding how things work without any specific application in mind. Applied research takes existing knowledge and applies it to solve a specific problem or create something new.
Investing in R&D can bring many benefits for companies, including increased efficiency, improved customer satisfaction, reduced costs, greater innovation potential, and better risk management capabilities.
Additionally, investing in R&D helps organizations stay ahead of industry trends by allowing them to develop cutting-edge products before their competitors do.
How does investing in R&D improve creativity?
R&D plays an important role in creativity because it allows teams to explore different ideas and concepts that may lead to innovative solutions. Investing in research could potentially yield creative outcomes such as customers being able to access new features or services.

(Source)
How Does Investing in R&D Improve Creativity?
Investing in research and development can help a company stay ahead of the competition, create new products or services, and develop innovative solutions to existing problems.
But R&D isn’t just about creating new products. It’s also about fostering creativity within the organization. By investing in R&D, companies can foster creative thinking that leads to breakthroughs and improved performance.
The Role of Innovation in Creativity
Innovation is essential for creativity because it encourages employees to think outside the box and come up with unique ideas that could potentially benefit the company’s bottom line. Innovative ideas are often generated through brainstorming sessions or other collaborative activities where teams work together to generate new concepts or approaches. This type of environment allows employees to be more open-minded and explore different possibilities without fear of failure or criticism from their peers.
The Impact of Investment on Creativity
Investing in R&D has a direct impact on creativity as well as productivity levels within an organization. When companies invest resources into researching potential solutions, they are providing their team members with the tools necessary for them to be creative thinkers.
Additionally, investing in R&D gives organizations access to cutting-edge technology which helps them stay competitive.
Strategies for Enhancing Creativity Through R&D Investments
Companies should focus on developing strategies that promote collaboration between departments so everyone involved feels like they have ownership over the outcome.
Additionally, businesses should look into utilizing data analytics platforms such as Cypris which provides rapid insights based on centralized data sources, automation tools, and collaboration platforms. All these technologies provide businesses with powerful ways to enhance their investment in research and development.
Tools and Technologies for R&D
Data analytics platforms are essential for optimizing research outputs and enhancing the effectiveness of investment in R&D. These platforms allow teams to quickly identify trends, correlations, and insights from large data sets that would otherwise be difficult or impossible to uncover.
For example, Cypris is a research platform specifically designed for R&D teams that centralizes all their data sources into one place so they can quickly find answers to their questions.
Automation tools are also invaluable when it comes to streamlining processes and increasing efficiency within an organization’s R&D operations. Automating mundane tasks such as collecting data or organizing files gives researchers more time to focus on higher-level activities like analyzing results or developing new ideas.
Automation tools also help reduce errors caused by manual input of information which can save organizations both time and money in the long run.
Finally, collaboration platforms are key for enhancing teamwork and productivity among members of an R&D team. Platforms such as Slack enable real-time communication between team members regardless of location while file-sharing services like Dropbox facilitate easy access to documents from any device with an internet connection.
Additionally, project management software like Asana helps keep track of tasks assigned across multiple projects so nothing falls through the cracks during busy periods of innovation activity.
FAQs About How Does Investing in R&D Improve Creativity
Why is R&D a key factor in productivity improvement?
R&D is a key factor in productivity improvement because it enables teams to develop and test new ideas quickly. It allows them to identify opportunities for innovation, create solutions that are tailored to customer needs, and bring products or services to market faster.
R&D also helps companies stay ahead of the competition by providing access to cutting-edge technologies and knowledge that can be used in product development. Ultimately, this leads to increased efficiency, higher quality products/services, and greater profitability for businesses.
How does R&D influence design?
R&D plays a critical role in the design process. It provides insights into customer needs, market trends, and technological advancements that inform product development decisions. R&D teams can identify opportunities for innovation and create solutions to meet those needs through research-driven strategies.
By leveraging data from multiple sources, R&D teams can develop innovative designs that are tailored to customers’ wants and needs while also staying ahead of competitors in terms of technology and features. Ultimately, R&D helps ensure successful product design by providing valuable insights throughout the entire development cycle.
Conclusion
How does investing in R&D improve creativity? By understanding the challenges associated with R&D investments and utilizing the right tools and technologies to maximize return on investment, companies can create an environment that encourages innovation and creative problem-solving.
By investing in R&D, organizations can increase their chances of unlocking new ideas that could lead to groundbreaking products or services. Cypris provides an easy-to-use platform that centralizes data sources teams need into one place so they can get insights quickly.
With Cypris‘ help, you’ll be able to drive innovation and creativity faster than ever before! Try out our R&D solutions today – let us show you how your business can benefit from the power of research and development!

How do global patents work? This is a question that many research and development teams face when considering their product innovation strategies. With the rise of international business, understanding how to obtain and maintain a global patent can be daunting.
At Cypris, we understand the challenges associated with obtaining and maintaining a global patent in today’s competitive environment—but also recognize the benefits it provides for your R&D team.
In this blog post, we will explore how do global patents work, how to apply for one, and the potential pitfalls of your investment in an international intellectual property asset.
Table of Contents
What is a Global Patent?
Benefits of Obtaining a Global Patent
Requirements for Obtaining a Global Patent
Challenges with Obtaining and Maintaining a Global Patent
Language Barriers and Cultural Differences
Time Frame for Obtaining and Maintaining a Global Patent
Strategies on How Do Global Patents Work
Research Local Laws and Regulations
What is a Global Patent?
A global patent is a legal document that grants an inventor exclusive rights to their invention in multiple countries. It allows the inventor to protect their intellectual property and benefit from it financially by preventing others from using, making, or selling the invention without permission.
The process of obtaining a global patent can be complex due to language barriers, cultural differences, and the laws in different countries pertaining to patents.
Benefits of Obtaining a Global Patent
Obtaining a global patent has several benefits for inventors who wish to protect their inventions on an international scale. A global patent ensures that any infringement on your intellectual property will be legally recognized across all applicable jurisdictions. This means you can take action against anyone who attempts to copy or steal your idea without permission no matter which country they are located in.
Additionally, having a globally recognized patent may help increase your chances of securing investors as well as provide potential customers with more confidence when considering purchasing products related to your patented technology.
Types of Global Patents
There are two main types of global patents available – regional patents and international applications (PCT).
Regional patents cover specific regions such as Europe (EPO), Eurasia (EAPO), and Africa (ARIPO).
International applications allow applicants to file one application covering up to 152 member states at once through WIPO’s PCT system. However, applicants must still pay individual fees for each country before being granted full protection under those jurisdictions’ respective laws.
Global patents provide an important tool for protecting inventions and innovations worldwide.
In the next section, we will explore the process of obtaining a global patent.
Key Takeaway: A global patent is a legal document that grants an inventor exclusive rights to their invention in multiple countries. A global patent allows you to take action against anyone who attempts to copy or steal your idea no matter which country they are located in.
How to Obtain a Global Patent
Obtaining a global patent is an important step for any business looking to protect its intellectual property. Here are the steps and requirements to ensure the validity of the patent.
The first step when obtaining a global patent is to research existing patents and determine if there are any similar products or services already patented. If so, then it may not be possible to obtain a valid patent on your product or service.
Once you have determined that no similar patents exist, you will need to file an application with each country’s respective Patent Office. This includes providing detailed information about your invention as well as drawings or diagrams of how it works.
Additionally, you will need to provide evidence that your invention is unique and has never been done before in order for it to qualify for protection under international law.
Requirements for Obtaining a Global Patent
In addition to filing an application with each country’s respective Patent Office, there are other requirements that must be met in order for the patent application process to move forward successfully. These include proving ownership of the invention, submitting proof of originality, providing evidence that all necessary paperwork has been completed, and paying all applicable fees associated with obtaining a global patent.
Cost Considerations
When considering whether or not obtaining a global patent is worth pursuing financially, businesses should take into account both upfront costs such as filing fees and attorney fees as well as ongoing costs such as maintenance fees which must be paid periodically in order to keep the rights valid.
Additionally, businesses should factor in potential legal expenses related to defending their rights against infringement from competitors who attempt to copy their inventions without permission.

(Source)
Challenges with Obtaining and Maintaining a Global Patent
Language Barriers and Cultural Differences
Obtaining a global patent requires navigating language barriers and cultural differences. For example, in some countries, the legal system is based on criminal law while others are based on civil law. This can lead to different interpretations of patent laws which can complicate the process of obtaining a global patent.
Additionally, many countries have their own unique regulations that must be followed when filing for a patent. Understanding these regulations can be difficult due to language barriers and cultural differences between countries.
Time Frame for Obtaining and Maintaining a Global Patent
The time frame for obtaining and maintaining a global patent varies from country to country depending on the complexity of the application as well as local regulations. Generally speaking, it takes at least two years before an international application is granted protection in all participating countries or regions.
After this period has elapsed, each individual country will need to confirm its grant decision separately within one year after notification by the World Intellectual Property Organization.
Furthermore, patents must be maintained through regular renewal fees in order to remain valid throughout their lifetime. Failure to do so may result in the loss of rights.
Enforcing a Global Patent
Enforcing international patents can also present challenges due to jurisdictional issues across borders as well as varying levels of enforcement among different nations’ court systems. It is important for companies to understand what kind of enforcement mechanisms exist within each jurisdiction they plan on operating in order to ensure that any potential infringements are dealt with swiftly and appropriately.
Having experienced counsel familiar with both domestic and international laws related to IP matters will help solve any disputes arising from potential infringement cases.
Key Takeaway: Obtaining a global patent is a complex process that requires overcoming language barriers, understanding cultural differences, and abiding by local regulations.
Strategies on How Do Global Patents Work
Research Local Laws and Regulations
It is important to research the local laws and regulations of any country you are considering applying for a patent. This will help ensure that your application meets all necessary requirements, as well as provide an understanding of what type of protection you can expect from the patent.
Additionally, it is important to be aware of any existing patents or intellectual property rights that may already exist in the region.
Work with Local Professionals
Working with experienced professionals who understand the local laws and regulations can be beneficial when obtaining a global patent. These professionals can provide guidance on how best to proceed with filing applications, advise on potential risks associated with certain countries or regions, and assist in ensuring compliance throughout the process.
Invest in Technology
Technology solutions such as Cypris can make obtaining a global patent much easier by providing access to centralized data. With all data sources in one platform, teams have greater visibility into their progress while reducing the manual effort required during each step of the process.
Ready to take your invention global? Make sure you research local laws and regulations, work with experienced professionals, and use a platform like Cypris for fast and efficient filing. #GlobalPatents #Innovation Click To Tweet
Conclusion
How do global patents work? Patents are a great way to protect your intellectual property and ensure that you are able to reap the rewards of your hard work. However, it is important to understand the process of obtaining and maintaining a global patent in order to maximize its effectiveness.
Are you part of an R&D or innovation team that needs to quickly access insights? Then look no further than Cypris! Our research platform allows your team to centralize data sources and make the most out of global patents.
With our solutions, your teams can work smarter and faster – get started today with Cypris!

Big data has become an essential part of the modern R&D landscape. With data analysis tools, companies can now gain a deeper understanding of how big data can revolutionize pharmaceutical R&D processes.
In this blog post, we’ll explore what big data is, how big data can revolutionize pharmaceutical R&D, and which technologies are used for this purpose.
We’ll also look into how companies should implement a successful strategy for making use of big data within their pharma R&D operations.
Table of Contents
What is Big Data?
How Big Data Can Revolutionize Pharmaceutical R&D
Improved Drug Discovery and Development Processes
Increased Efficiency in Clinical Trials and Regulatory Compliance
Big Data Technologies for Pharmaceutical R&D
Benefits of Big Data in Pharmaceutical R&D
Improved Decision-Making and Cost Savings
Enhanced Quality Control and Safety
Accelerated Time To Market For New Drugs And Treatments
How Big Data Means Big Opportunities for Pharma Industry
What is Big Data?
Big Data is a term used to describe the massive amounts of data that organizations collect and store. It can include structured, semi-structured, and unstructured data from various sources such as customer interactions, sensor readings, machine logs, social media posts, and more.
Big Data has become increasingly important in recent years due to its ability to provide predictive analytics when combined with advanced analytical techniques such as artificial intelligence (AI) or machine learning (ML).
Benefits of Big Data
The use of big data allows companies to gain valuable insights into their customers’ behaviors, preferences, needs, and wants. Companies can also use this information for marketing campaigns targeting specific audiences or groups based on their interests or demographics.
Additionally, big data helps companies identify potential risks before they occur so they can take proactive measures against them.
Finally, it enables businesses to make better decisions by analyzing large datasets quickly using AI/ML algorithms instead of relying solely on manual processes.
Challenges of Big Data
Despite the numerous benefits associated with big data analysis, there are still some challenges that need to be addressed before they can be fully utilized in business operations. These include privacy concerns when collecting personal information, security issues when storing sensitive information, lack of skilled personnel, costs in setting up the infrastructure, and scalability issues when dealing with real-time streaming applications.

(Source)
How Big Data Can Revolutionize Pharmaceutical R&D
Big data is revolutionizing the pharmaceutical industry by providing new opportunities for drug discovery and development. With the use of big data, researchers can analyze vast amounts of information to gain insights into how drugs work in different contexts. This helps them make better decisions about which drugs to pursue and develop more quickly.
Improved Drug Discovery and Development Processes
Big data has enabled researchers to identify potential drug targets faster than ever before by analyzing large datasets from clinical trials, patient records, genomics studies, and other sources. By leveraging this information, they can determine which molecules are most likely to be effective against a particular disease or condition.
Additionally, big data allows researchers to compare multiple treatments side-by-side in order to identify those that offer the best outcomes for patients.
Increased Efficiency in Clinical Trials and Regulatory Compliance
Big data also provides an efficient way for pharmaceutical companies to conduct clinical trials by helping them design experiments that yield reliable results while minimizing costs.
Furthermore, it enables companies to ensure regulatory compliance by tracking changes in regulations across countries as well as monitoring safety protocols during drug development processes.
Big data can help improve patient care through personalized medicine initiatives based on individual genetic profiles or lifestyle factors like diet or exercise habits. This can lead to improved health outcomes for patients overall.
Additionally, it can be used to monitor treatment effectiveness over time so physicians can adjust medications accordingly if needed.
Key Takeaway: Big data is revolutionizing the pharmaceutical industry by enabling researchers to identify potential drug targets faster and make better decisions about which drugs to pursue. It also provides an efficient way for companies to conduct clinical trials, ensure regulatory compliance, and improve patient care through personalized medicine initiatives.
Big Data Technologies for Pharmaceutical R&D
Big Data has revolutionized the way pharmaceutical companies approach R&D. To leverage Big Data effectively, organizations must use the right technologies.
Artificial Intelligence (AI) and Machine Learning (ML) are two of the most powerful tools for analyzing large datasets. AI algorithms can be used to identify patterns in data that may not be obvious at first glance. ML models can then be trained on these patterns to make predictions about future outcomes or trends.
These technologies are being used by pharmaceutical companies to accelerate drug discovery and development processes, improve clinical trial results, and enhance patient care outcomes.
Natural Language Processing (NLP) is another technology that is becoming increasingly important for Big Data analysis in pharmaceutical R&D projects. NLP enables computers to understand human language so they can interpret unstructured text-based data such as medical records or reports from clinical trials more accurately than ever before. This technology helps researchers uncover hidden relationships between different variables which could lead to new discoveries or treatments.
Cloud computing platforms provide a secure environment where teams can store their data safely while still allowing them access from anywhere with an internet connection. This makes it easy for remote teams to collaborate without having to worry about security issues.
Cloud computing also allows organizations to scale up quickly when needed without having to invest in more hardware infrastructure. This is ideal for big data projects that require the processing and storage of massive amounts of data points over long periods of time.
Key Takeaway: Big Data can revolutionize pharmaceutical R&D by leveraging powerful technologies such as Artificial Intelligence (AI), Machine Learning (ML), Natural Language Processing (NLP), and cloud computing platforms.
Benefits of Big Data in Pharmaceutical R&D
Big data has revolutionized the pharmaceutical industry, offering a range of benefits to R&D teams. By leveraging big data, research and development teams can make more informed decisions faster and at lower costs.
Improved Decision-Making and Cost Savings
Big data provides researchers with access to vast amounts of information which allows them to identify trends in drug efficacy or safety. Additionally, big data helps reduce the cost of conducting clinical trials by providing insights into patient populations that are most likely to respond positively to treatments.
Enhanced Quality Control and Safety
With access to large datasets, researchers can better monitor quality control standards throughout the entire process from drug discovery through manufacturing and distribution. Big data also helps ensure safety standards are met by providing real-time monitoring capabilities for adverse events in clinical trials.
Accelerated Time To Market For New Drugs And Treatments
By utilizing predictive analytics tools powered by big data, researchers can accelerate time-to-market for new drugs or treatments by identifying which ones have higher chances of success before they enter clinical trials. This shortens their timeline from concept to approval.
How Big Data Means Big Opportunities for Pharma Industry
Big data is revolutionizing the pharmaceutical industry. By leveraging big data analytics, pharma companies can gain insights into their customer base and develop more effective drugs.
Big data allows them to identify new candidates for drug trials and develop them into effective medicines faster than ever before.
Big data also helps pharma companies to streamline complex business processes and improve efficiency in operations. This leads to higher profitability as well as better decision-making capabilities.
With the help of big data analytics, pharma companies can analyze trends, predict outcomes, make smarter decisions, and optimize resources for maximum impact.
In addition to this, big data can be used by pharma companies to monitor patient enrolment in clinical trials more effectively and accurately assess the efficacy of drugs under development or already on the market.
It also helps with personalized medicine initiatives by allowing healthcare providers access to individualized health records that are constantly updated with real-time information from various sources such as sensors or social media platforms like Twitter or Facebook.
The use of big data analytics has enabled life sciences organizations around the world to reduce costs while improving accuracy in research activities related to drug discovery and development. When it comes to analyzing large volumes of structured and unstructured datasets, a centralized platform like Cypris makes it easier for R&D teams to get quick actionable insights without having to spend too much time managing multiple disparate systems all at once.
Conclusion
By leveraging the right technologies such as AI, ML, and NLP, companies can unlock the power of big data to gain competitive advantages in their industry. And with Cypris’ research platform, companies have access to all of their data sources in one place and are able to quickly uncover valuable insights that will help them stay ahead of the competition.
This is how big data can revolutionize pharmaceutical R&D.
If you are looking to revolutionize pharmaceutical R&D, Cypris is the answer. Our research platform provides rapid time to insights and centralizes data sources into one convenient platform. With our advanced tools, teams can more easily analyze large amounts of complex data quickly and accurately.
Stop wasting valuable time on tedious tasks – join us in ushering in a new era of pharmaceutical innovation with big data!

The success of any product or service lies in the research and development that goes into it. But what about marketing research? Are marketing research costs included in R&D budgets?
The answer is not so simple as there are multiple factors at play when it comes to deciding how much should be allocated towards each type of project. In this blog post, we’ll explore what exactly R&D and marketing research are, how are they related to one another, and how are marketing research costs included in R&D.
Table of Contents
Benefits of Marketing Research
How is Marketing Research Related to R&D?
Are Marketing Research Costs Included in R&D?
Strategies for Optimizing R&D and Marketing Research Projects
FAQs About “Are Marketing Research Costs Included in R&D?”
What costs are included in R&D?
What type of expense is market research?
What is R&D?
Research and Development (R&D) is a process of creating new products, services, or processes. It involves the systematic investigation into existing technologies and theories to create something that has never been seen before. This can include researching materials, developing prototypes, testing designs, analyzing data from experiments and surveys, as well as refining existing products or services.
There are two main types of research and development: basic research and applied research.
Basic research focuses on understanding the fundamentals behind a particular concept or phenomenon while applied research takes this knowledge to develop practical applications for it in real-world scenarios.
There is also what we call exploratory research which looks at potential solutions without any specific goal in mind.
Experimental research tests out different approaches to solving a problem.
Product design and engineering create physical objects while software engineering develops computer programs.
Market intelligence gathering collects information about competitors’ activities in order to gain an edge over them, and marketing analysis studies customer behavior patterns.
R&D is a critical component of innovation and growth, as it enables teams to explore new ideas, test theories, and create new products. By understanding the types of R&D available, organizations can ensure they are making informed decisions on their research investments.
Now let’s look at marketing research costs in relation to R&D.
(Source)
What is Marketing Research?
Marketing research is the systematic gathering, recording, and analysis of qualitative and quantitative data about customers, markets, and competitors. It helps businesses to understand what their target market wants and needs from them. This information will guide them when making decisions about product development, pricing strategies, promotional activities, and customer service initiatives.
Types of Marketing Research
There are several types of marketing research that can be used, depending on the type of information needed.
- Primary research (interviews with potential customers).
- Secondary research (analysis of existing data sources such as industry reports or surveys).
- Observational studies (observing how people interact with products or services).
- Focus groups (gathering a group together to discuss a particular topic).
- Experimental studies (testing different versions of a product).
Each type has its own advantages and disadvantages which should be considered when selecting the best approach for your business.
Benefits of Marketing Research
The advantages of engaging in marketing research activities are plentiful. First, it provides businesses with a better understanding of their target market’s preferences, allowing them to tailor their offerings accordingly.
Additionally, it gives an insight into competitive activity so companies can create strategies for staying ahead.
Finally, it enables businesses to recognize potential growth opportunities within new markets or segments, leading to improved decision-making capabilities and thus long-term success for any organization.
Marketing research is a vital tool for R&D and innovation teams to understand their customers, market trends, and competition. With the right data in hand, teams can make informed decisions that drive success.
R&D teams, don’t forget to include marketing research costs in your budget! It’s the key to unlocking insights and staying ahead of the competition. #MarketingResearch #Innovation Click To Tweet
How is Marketing Research Related to R&D?
R&D and marketing research are two distinct fields, but they share some similarities. Both involve gathering data to inform decisions, though the types of data collected differ.
R&D typically focuses on technological advances while marketing research looks at consumer preferences and trends.
Similarities between R&D and marketing research include:
- Gathering data – both involve collecting information from various sources.
- Analyzing results – both require analysis of the gathered data in order to draw conclusions.
- Making decisions – both use the analyzed results to determine a course of action or strategy for their respective fields.
Differences between R&D and marketing research include:
- Focus – R&D tends to focus on developing new technologies or improving existing ones, while marketing research looks at consumer behavior.
- Data collection methods – R&D often relies on laboratory experiments or surveys while marketing research utilizes more qualitative methods such as interviews or focus groups.
- Results – The results obtained from each type of research can be used for different purposes. For example, the findings from an R&D project may be used by engineers to develop a new product whereas those from a market research study could help guide a company’s advertising campaigns.
Businesses often use market research and consumer research to gain insights into their target audience. While there are differences between these two disciplines, they can also complement one another when it comes to making important business decisions.
Key Takeaway: R&D and marketing research are both essential to the success of a business but have distinct differences in terms of their goals and objectives. By understanding these distinctions, teams can make better decisions about which strategies to pursue to get maximum results.
Are Marketing Research Costs Included in R&D?
When it comes to determining if costs associated with marketing research should be included in R&D expenses, there are several factors to consider.
The first factor is the purpose of the research project. If the primary goal of the project is to develop new products or processes, then it would likely qualify as an R&D expense and could be included in R&D expenses.
On the other hand, if the primary goal of the project is market analysis or customer feedback, then it would likely not qualify as an R&D expense and should not be included in R&D expenses.
Another factor to consider is how closely related they are to product development efforts. If there is a direct connection between a particular marketing research activity and product development efforts (e.g., researching customer preferences for features on a new product), then those costs may qualify as an R&D expense.
However, if there isn’t any direct connection between a particular marketing research activity and product development efforts (e.g., researching general trends within an industry), then those costs may not qualify as an R&D expense.
Finally, another factor that must also be taken into consideration is how much value will actually result from conducting such activities. For example, if conducting a market analysis can lead to potential opportunities for developing new products or services, then those costs may be considered part of your R&D budget.
Strategies for Optimizing R&D and Marketing Research Projects
One of the most effective ways to reduce costs while maintaining quality results is automation.
Automation can help streamline processes, reduce manual labor, and improve accuracy. Additionally, it can help with data collection and analysis, which can save time and money.
Other cost-saving strategies include outsourcing tasks that are not core competencies or require specialized skillsets, using open source tools, and utilizing cloud computing services such as Amazon Web Services (AWS) or Microsoft Azure.
To maximize the benefit from both projects, teams should focus on setting clear objectives upfront so they know what success looks like before beginning any work.
Leveraging existing data sources within an organization will enable teams to quickly gain insights without having to start from scratch.
Employing agile methodologies throughout each project’s lifecycle will allow teams to adjust their approach based on feedback to ensure maximum impact upon the completion of each project.
Involving stakeholders early on in both R&D and marketing research projects helps ensure alignment between all parties involved, which leads to better decision-making.
Conclusion
Are marketing research costs included in R&D?
It is important to understand the relationship between R&D and marketing research in order to optimize the cost-benefit ratio for both projects. While there are no hard and fast rules about whether or not marketing research costs should be included in R&D budgets, understanding how these two areas of business interact can help teams make informed decisions that will benefit their bottom line.
Are you an R&D or innovation team looking to gain rapid insights and maximize your budget? Look no further than Cypris! Our platform is designed specifically for teams like yours, centralizing data sources into one easy-to-use interface.
Cut down on research costs while getting the most out of marketing research with our innovative solutions that provide results quickly – start now and see how much time and money you can save.

R&D is an ever-evolving process that has recently seen a shift toward the application of computer science in research and development. By leveraging computer science, teams are able to unlock new insights from data faster than ever before. From predictive analytics to artificial intelligence, these technologies have revolutionized how R&D teams can develop products more efficiently while staying ahead of their competitors.
In this blog post, we will explore the application of computer science in research and development as well as discuss some examples, benefits, and challenges associated with its use.
Table of Contents
Overview of Computer Science in Research and Development
Benefits of Computer Science in R&D
Challenges of Computer Science in R&D
Benefits of Computer Science in R&D
Increased Efficiency and Productivity
Improved Accuracy and Quality Control
Reduced Costs and Time-to-Market
5 Trends in Computer Science Research
Overview of Computer Science in Research and Development
Computer science is the study of algorithms and data structures that enable computers to solve problems. It involves creating algorithms that can be used by machines or programs to complete tasks efficiently and accurately. This includes developing software applications for specific purposes such as machine learning (ML), artificial intelligence (AI), natural language processing (NLP), image recognition, and robotics.
The application of computer science in research and development has become increasingly important due to its ability to help teams quickly analyze large amounts of data, automate processes, and uncover insights faster than ever before.
Benefits of Computer Science in R&D
The application of computer science in research and development provides numerous benefits.
- Increased efficiency in analysis.
- Improved accuracy.
- Faster decision-making.
- Better collaboration between team members.
- Enhanced security measures.
- Cost savings through automation.
- Access to real-time insights into customer behavior patterns.
- Improved customer experience through personalized services.
- More accurate predictions based on historical trends and more reliable forecasting models.
Additionally, computer science helps organizations gain a competitive advantage by providing them with the ability to develop innovative products at a faster rate than their competitors while also reducing costs associated with product development cycles.
Challenges of Computer Science in R&D
While there are many advantages associated with the application of computer science in research and development, there are also some challenges that need to be taken into consideration. These include:
- Ensuring compliance with regulations related to privacy or intellectual property rights.
- Managing resources effectively.
- Training personnel adequately so they can use the tools correctly.
- Guarding against cyber threats.
- Maintaining high levels of accuracy when dealing with large datasets.
- Keeping up-to-date on new technologies being developed within the industry.

(Source)
Benefits of Computer Science in R&D
Computer science has revolutionized the way research and development (R&D) teams work. With its powerful tools, computer science enables R&D teams to achieve greater efficiency and productivity in their projects.
Increased Efficiency and Productivity
Computer science helps R&D teams become more efficient by automating mundane tasks such as data collection, analysis, and reporting. This allows them to focus on the creative aspects of their projects instead of spending time on tedious manual processes.
Additionally, computer science provides access to a wide range of software that can be used to improve workflow management and project tracking which leads to increased productivity across the board.
Improved Accuracy and Quality Control
Computer science also offers improved accuracy when it comes to data collection, analysis, and reporting due to its ability to quickly process large amounts of information with minimal errors or omissions. This makes it easier for R&D teams to identify potential problems before they arise which improves quality control throughout the entire product lifecycle from concept through commercialization stages.
Reduced Costs and Time-to-Market
Finally, utilizing computer science in R&D projects reduces costs associated with labor-intensive activities like data entry or manual testing procedures. It also speeds up production times so products are able to reach the market faster.
Key Takeaway: Investing in computer science for your R&D team is an invaluable asset that will provide long-term benefits. It can increase efficiency and productivity, improve accuracy and quality control, reduce costs, and shorten time-to-market – all of which are essential to successful innovation outcomes.
5 Trends in Computer Science Research
- Artificial Intelligence: AI is revolutionizing the way we interact with computers and machines, enabling them to understand complex tasks and make decisions without human input. AI technologies are being used in a variety of industries, from healthcare to finance, to improve efficiency and accuracy while reducing costs.
- Machine Learning: Machine learning is an application of artificial intelligence that allows computers to learn from data without explicit programming instructions. It can be used for predictive analytics, natural language processing, image recognition, facial recognition, and more. With machine learning technology becoming increasingly accessible through cloud computing platforms, it’s no wonder why this trend has been gaining so much traction lately!
- Big Data: The term “big data” refers to large sets of structured or unstructured data that require advanced tools for analysis and storage capabilities beyond traditional databases or spreadsheets. Companies use big data analytics solutions such as Hadoop or Spark for a wide range of applications including customer segmentation, fraud detection, and market forecasting among others – all powered by computer science research breakthroughs!
- Internet Of Things: IoT is the network of physical objects embedded with sensors connected via internet protocols which enable them to collect real-time information about their environment as well as communicate with other devices on the same network. From smart homes to autonomous vehicles – there are endless possibilities when it comes to leveraging this technology in our everyday lives!
- Cyber Security: As digital systems become increasingly interconnected across multiple networks worldwide, cyber security becomes even more important than ever! Computer scientists have been working hard at developing new methods for protecting sensitive information against malicious attacks such as malware and ransomware threats which can cause serious damage if left unchecked!
Conclusion
The application of computer science in research and development enables teams to access data sources more easily, analyze large datasets faster, and develop new products or services with greater efficiency. While there are challenges such as data security concerns and the need for specialized skill sets, the benefits far outweigh any potential drawbacks.
Are you an R&D or innovation team looking for a research platform that will provide rapid time to insights? Look no further than Cypris! Our platform centralizes all of your data sources into one easy-to-use interface, making it easier and faster to get the answers you need.
Sign up now and start getting results in record time!


Multiple studies concur that listening to music has a powerful impact on the brain. In fact, it's been shown to reduce things like anxiety, stress, blood pressure, pain, and improve sleep quality, mood, alertness, immune function, memory, and so much more. In the past year, new literature has brought to light the music's impact on cognitive ability and brain plasticity, in particular. In this blog, we’ll dive into the market outlook, innovation activity within the space, and recent scientific literature centered on how music improves cognitive abilities, particularly in relation to playing musical instruments, listening to your favorite music, and dancing.
Market outlook:
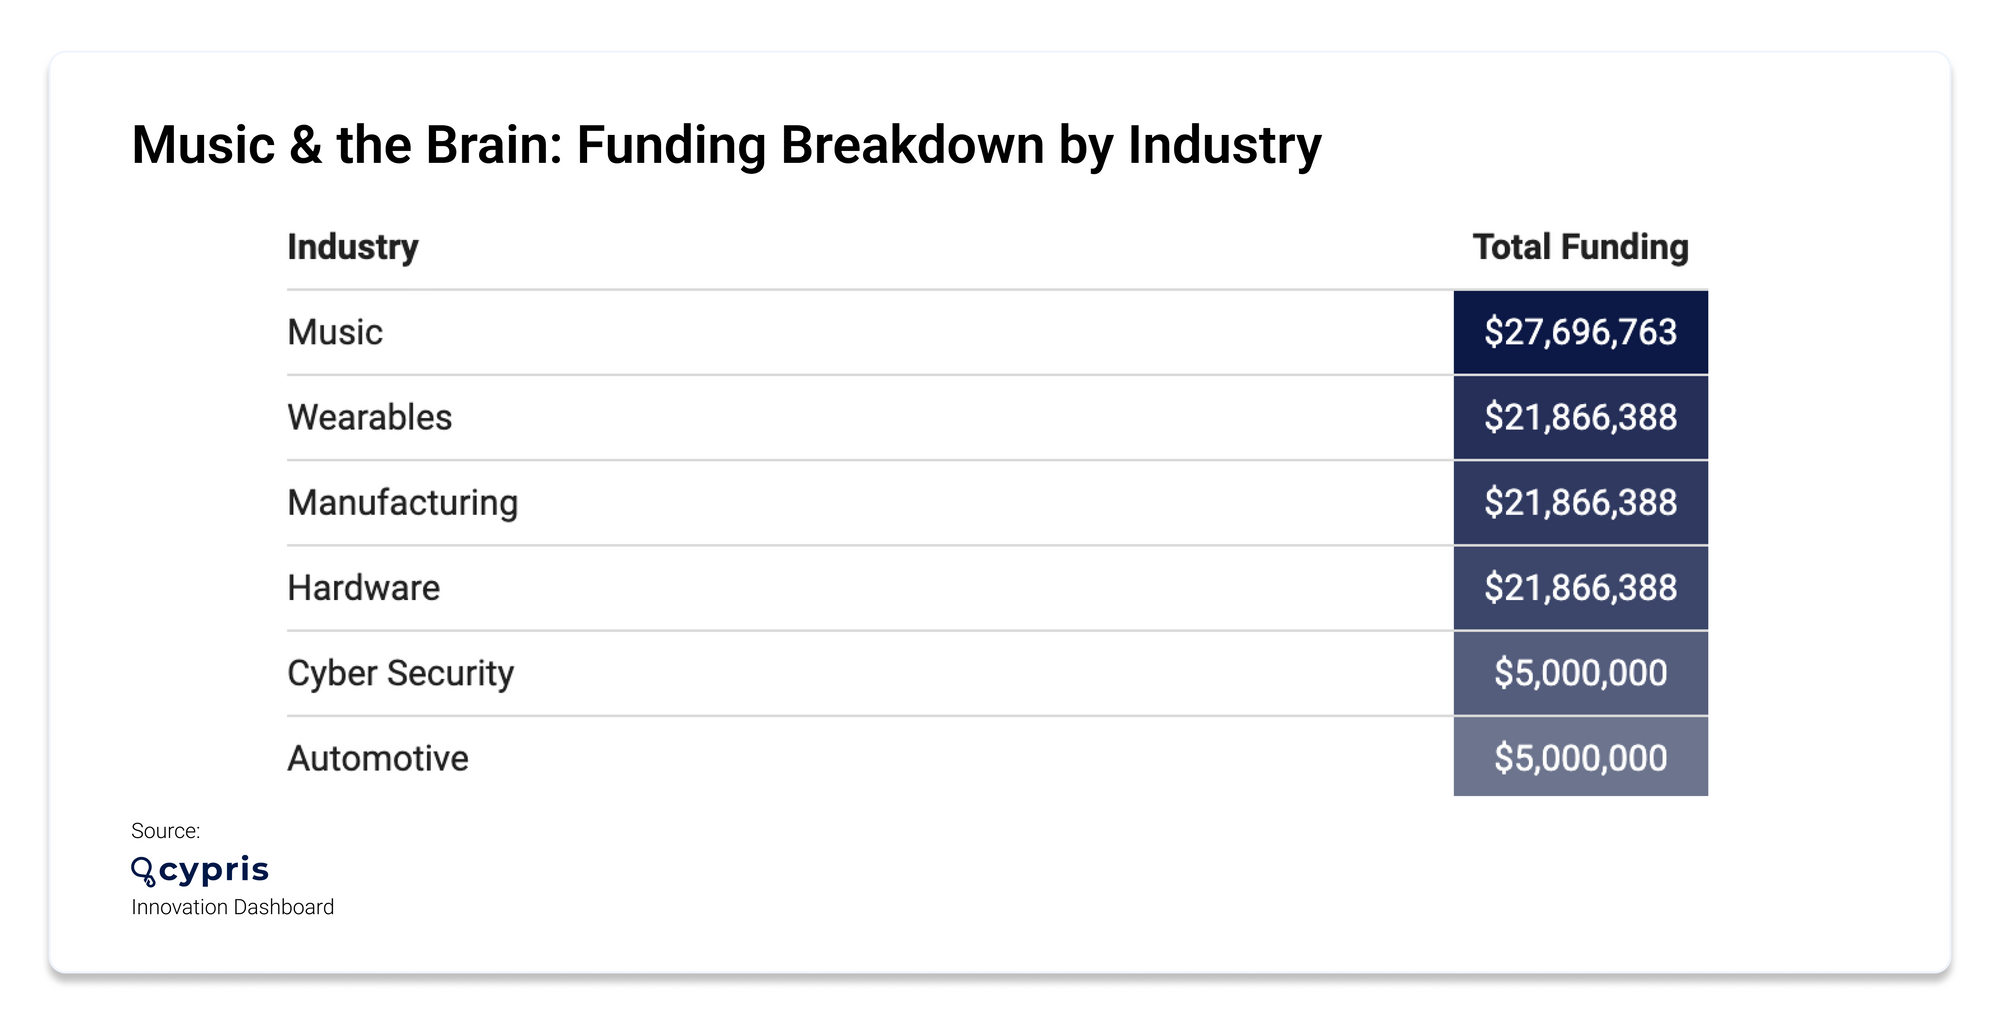
We used the Cypris Innovation Dashboard to pull data on the research area of music and the brain. According to our report, 15 new organizations entered the space last year, the majority of which were based in USA. Of the 15 organizations, 11 were startups. Below, you can see the funding breakdown for startups by industry.
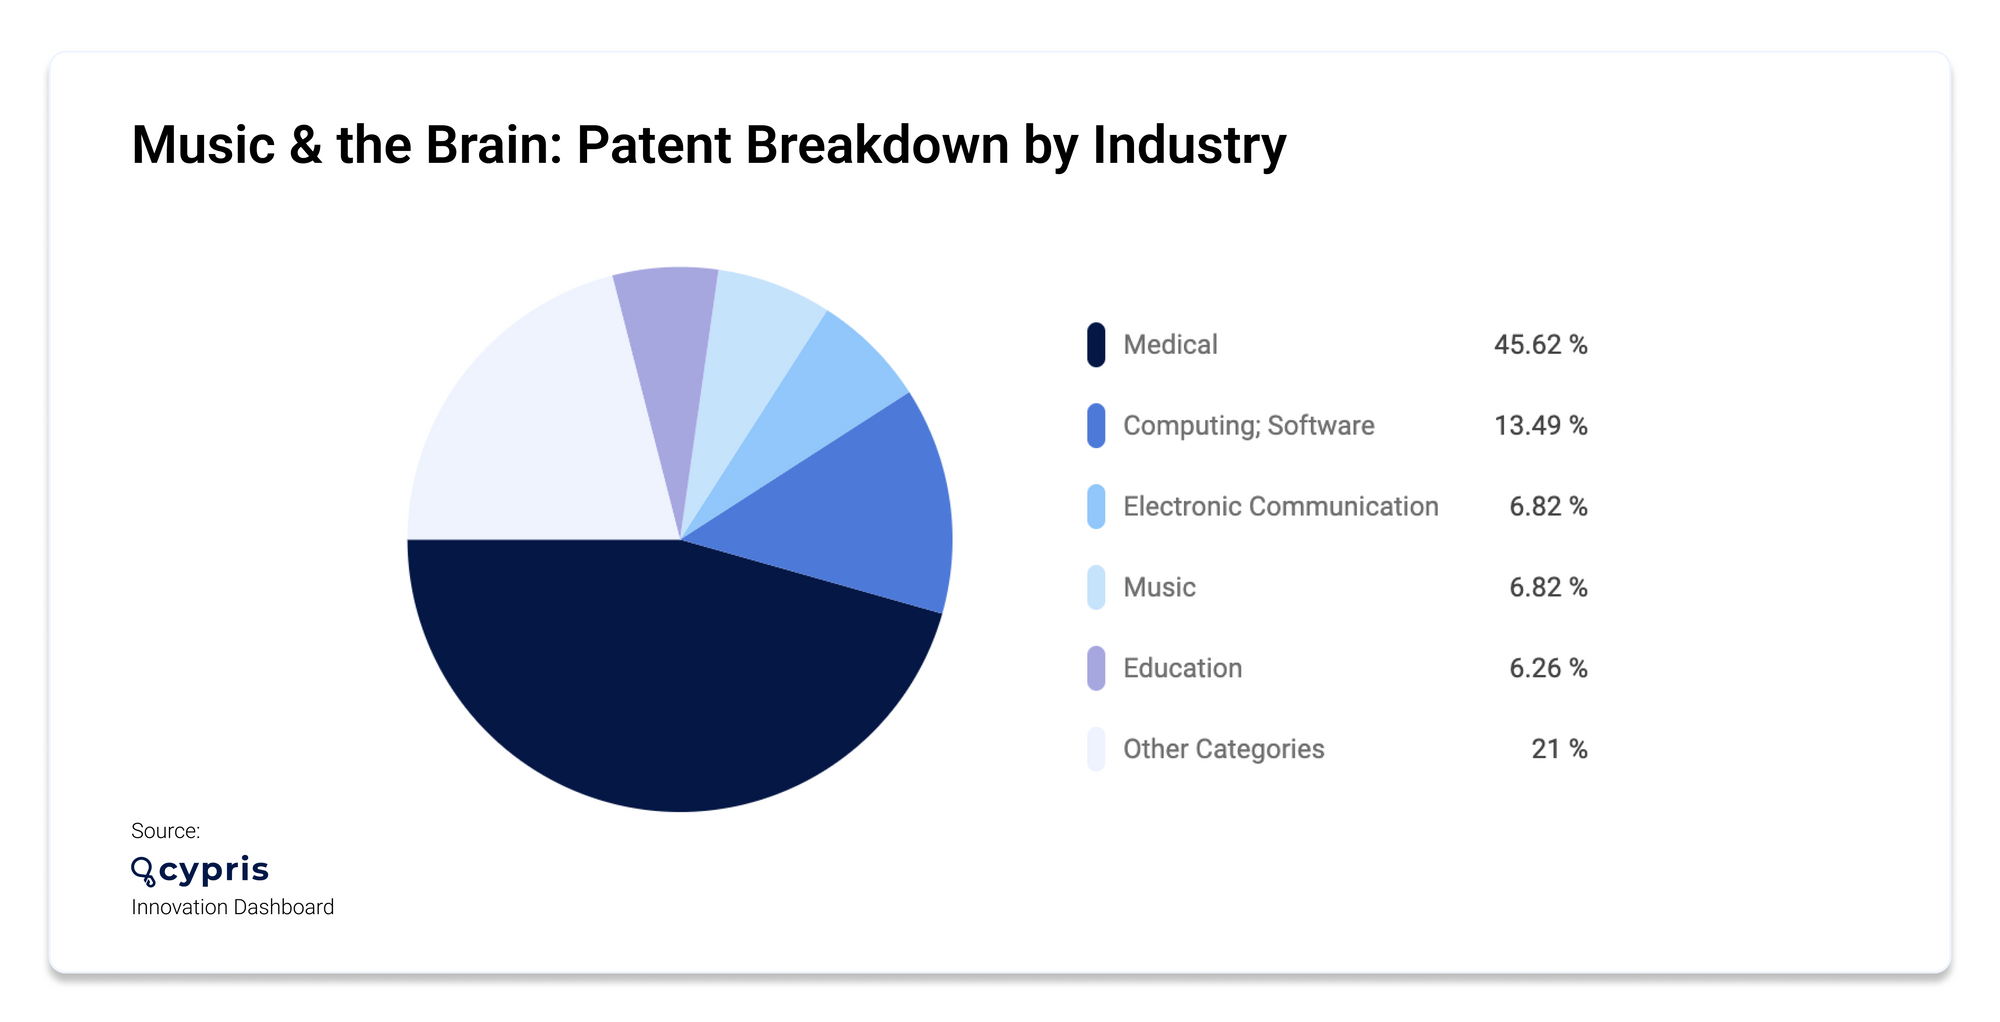
Scientific literature in the field saw the addition of 4,382 new research papers in the last year, while only 64 new patents were published in the space. Most of the patent activity centered on medical applications, with computing software coming in second.
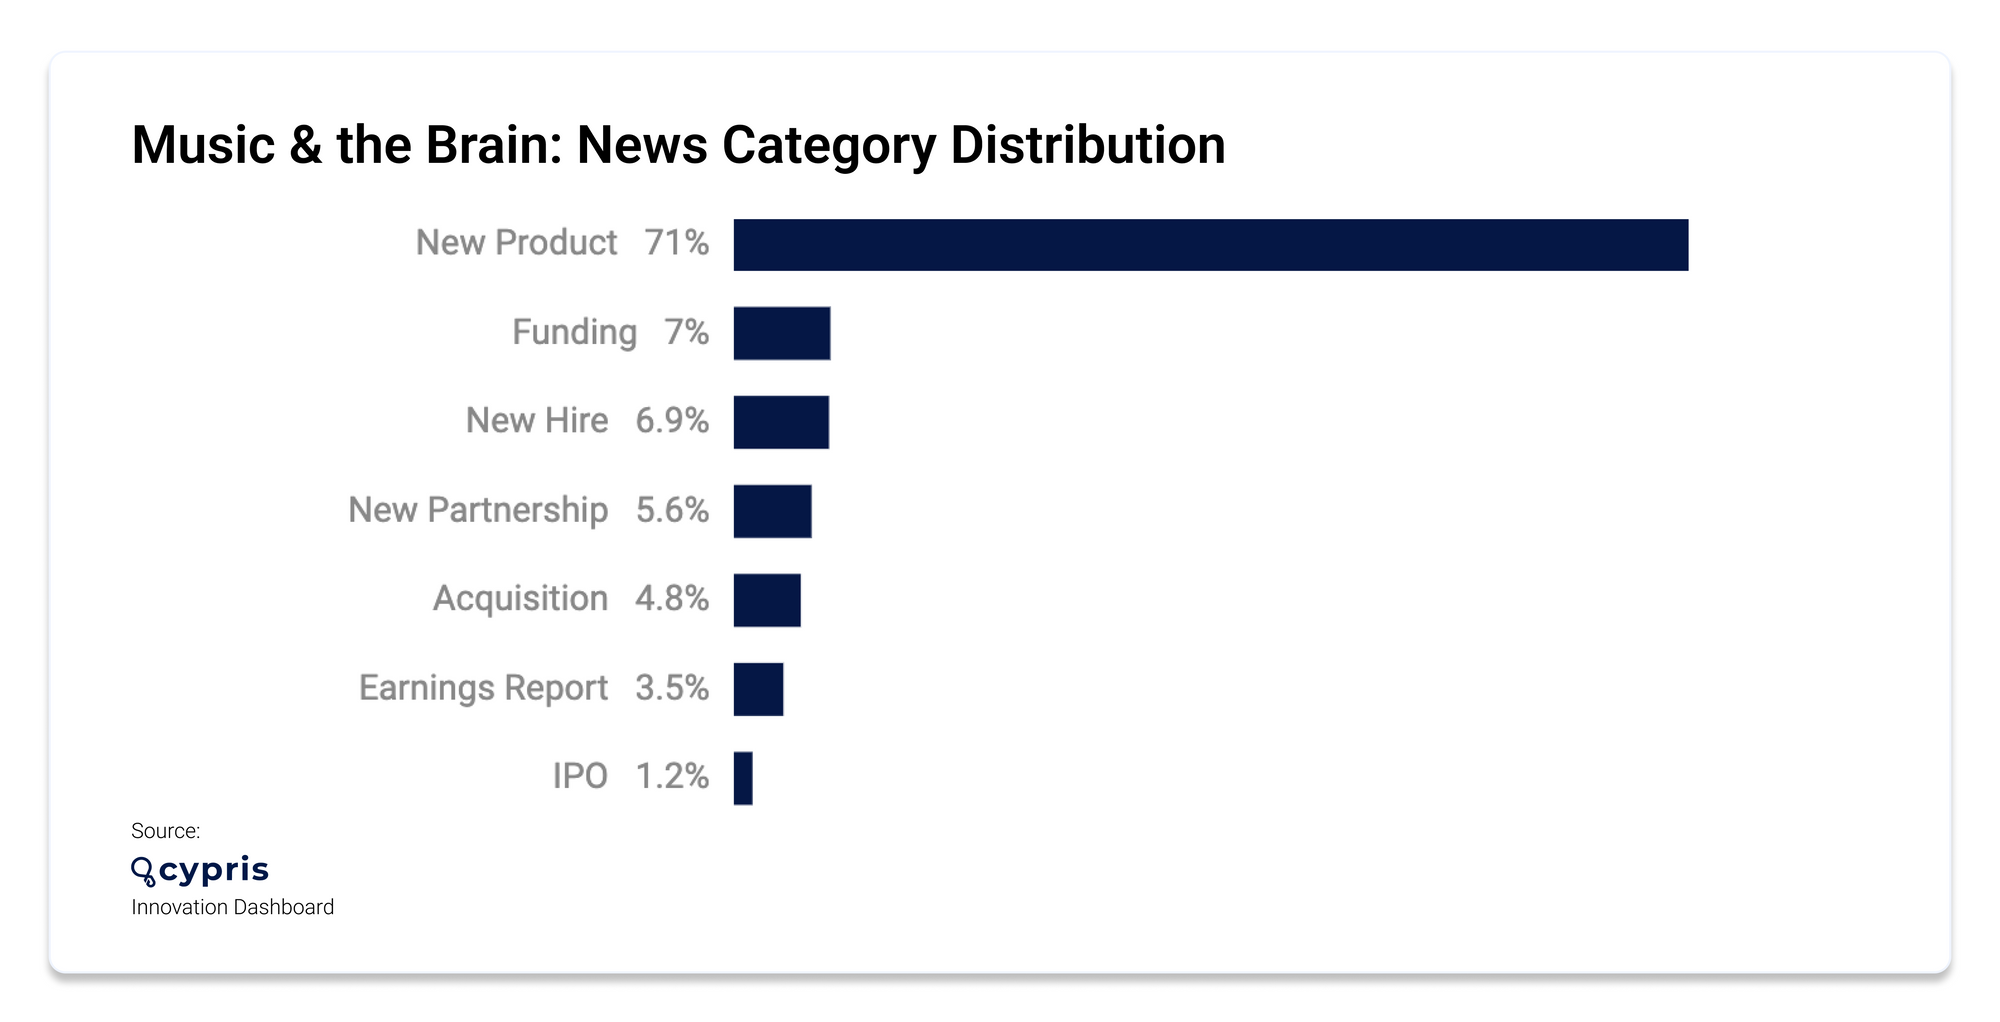
News coverage in the space boomed—with 89,798 news articles written in the last year, 71.05% of which were in the New Product category.
Research on music’s impact on cognitive ability
Let's take a look at the recent research studies examining the connection between music and brain function:

Playing a musical instrument in childhood improves cognitive ability in older age
The University of Edinburgh tested the cognitive ability of participants twice in their lives—at age 11 and age 70—using questions that included verbal reasoning, spatial awareness and numerical analysis portions. Out of the 366 study participants, 117 reported some experience of playing a musical instrument primarily during childhood and adolescence. Most commonly participants played the piano, but the instruments were wide ranging.
The results revealed that people with more experience of playing a musical instrument showed greater lifetime improvement on a test of cognitive ability than those with less or no experience. Researchers found that this was the case even when accounting for their socio-economic status, years of education, childhood cognitive ability, and their health in older age.
However, the researchers did note that the results don’t prove musical training boosts cognitive ability due to other confounding factors like parental influence, which could play a role.
Emeritus Professor Ian Deary, formerly Director of the Centre for Cognitive Ageing and Cognitive Epidemiology at the University of Edinburgh, said: “We have to emphasize that the association we found between instrument-playing and lifetime cognitive improvement was small, and that we cannot prove that the former caused the latter.
“However, as we and others search for the many small effects that might contribute toward some people’s brains aging more healthily than others, these results are worth following up.”

Listening to your favorite music improves brain plasticity
Patients in Toronto experiencing early-stage cognitive decline participated in a study where they each listened to a curated playlist that featured music that held significant meaning in their lives. The 14 participants, six of whom were musicians and eight non-musicians, listened to their playlist for an hour per day for three weeks.
MRI scans taken before and after the listening period compared their responses to new music they hadn't previously heard, and the long-known music they were attached to. Music, in general, activated the brain’s auditory cortex, but the familiar music lit up significant regions of the brain, including the prefrontal cortex. The prefrontal cortex is responsible for higher order executive functioning like decision-making, personality expression, and regulating emotions. Whether they were musicians or not, all participants demonstrated improved cognition.
Dr Michael Thaut is the senior author of the study, as well as being the director of the Music and Health Science Research Collaboratory, Tier One Canada Research Chair in Music, Neuroscience and Health, and professor at the University of Toronto's Faculty of Music and Temerty Faculty of Medicine.
"We have new brain-based evidence that autobiographically-salient music—that is, music that holds special meaning for a person, like the song they danced to at their wedding—stimulates neural connectivity in ways that help maintain higher levels of functioning," says Dr. Thaut.

Dancing to groovy music improves cognitive function
Researchers from University of Tsukuba in Japan performed functional near-infrared spectroscopy (fNIRS) with a color-word matching task on participants to examine inhibitory executive function before and after listening to music, as well as conducted a survey about the subjective experience of listening to groove music. Their goal was to examine the effect of groove music on executive function or brain activity in regions associated with executive function, such as the left dorsolateral prefrontal cortex (l-DLPFC).
Their findings revealed that dancing to ‘music with a groove’ can boost cognition, executive function and overall brain performance, as well as prevent diseases like dementia.
“The results were surprising,” explains lead author Professor Hideaki Soya. “We found that groove rhythm enhanced executive function and activity in the l-DLPFC only in participants who reported that the music elicited a strong groove sensation and the sensation of being clear-headed.”
Notably, those who were most familiar with the music experienced more improved brain function.
Whether it comes to playing an instrument as a child, listening to your favorite tunes, or dancing to groovy music, music has a profound impact on cognitive ability and brain plasticity. If you're curious to learn more about another topic of interest using data from our innovation dashboard, visit cypris.ai to get started.
Sources:
Cypris Innovation Dashboard, query: Music and the brain
https://www.nature.com/articles/s41598-022-11324-3
https://www.ed.ac.uk/news/2022/music-in-childhood-boosts-brains-in-later-life
https://www.mirror.co.uk/news/uk-news/learning-play-musical-instrument-child-28199852
https://www.abc.net.au/classic/read-and-watch/news/favourite-music-can-boost-brain-function/13661074
https://www.sciencedaily.com/releases/2022/05/220527101244.htm

.avif)