For the best experience, this project uses the Webflow Input Enhancer extension. We highly recommend installing it. Click here to download (use preview mode to access link)
The Highlights section is designed to provide an overview of key activities in your market within a given time frame based on your search results.
You will see the number of Research Papers, Patents and Organizations relevant to your search.
You can filter your search results by Relevance and Date by clicking the drop-down arrow.
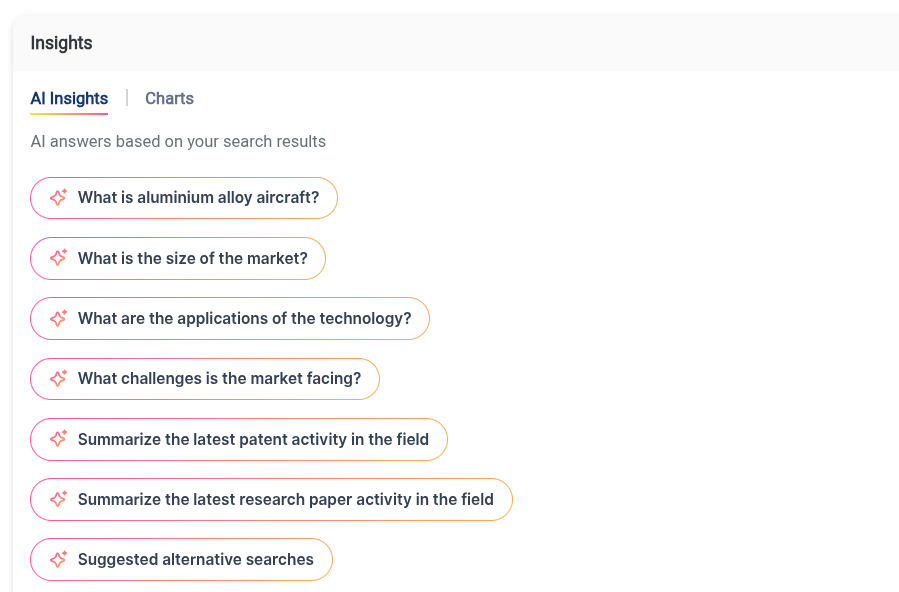
Additionally, you will see AI Insights under the Highlights section based on your search results.
Click on each insight to read AI summaries based on your search results.
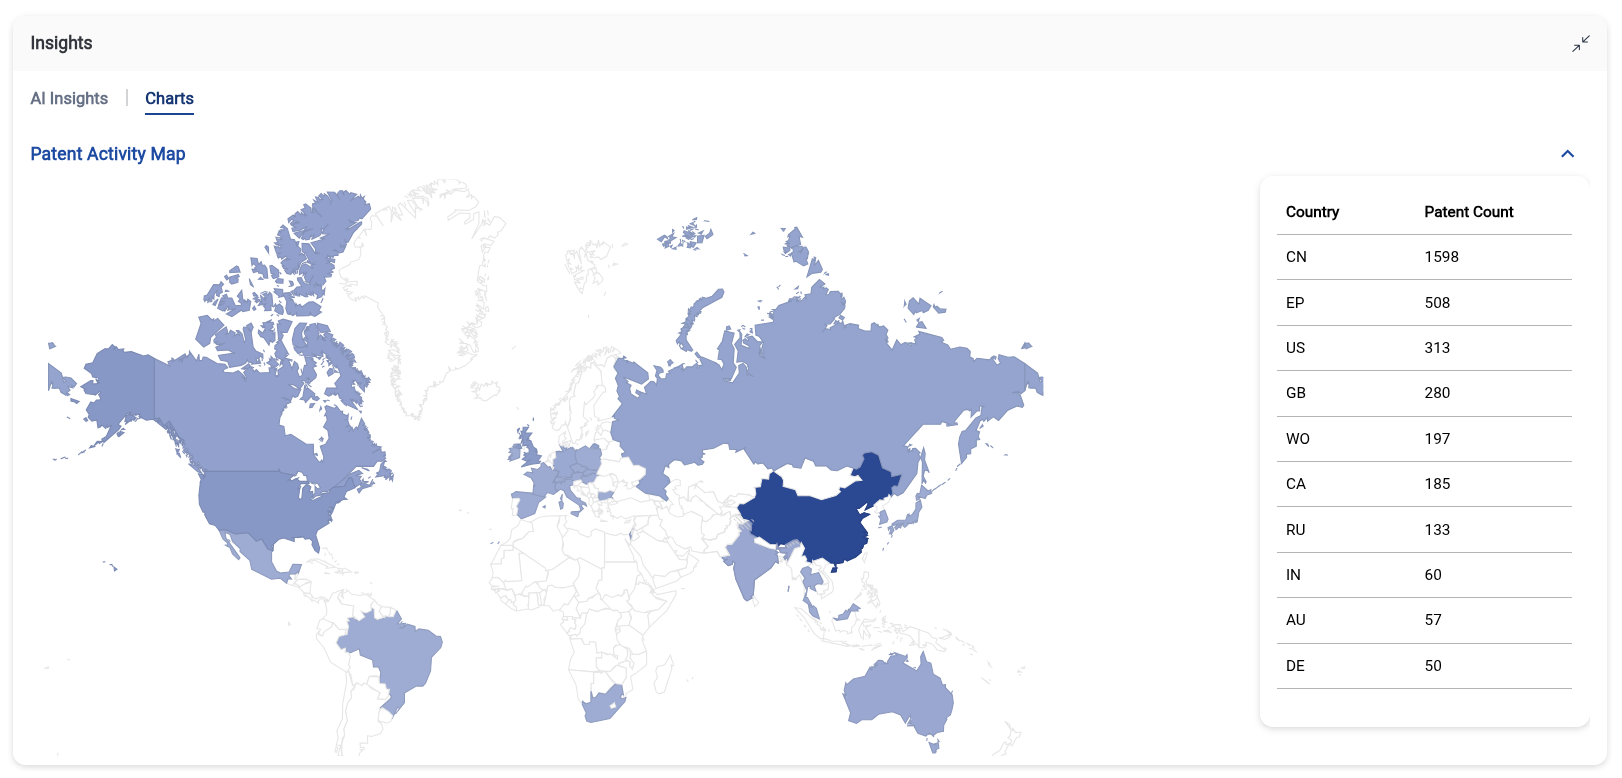
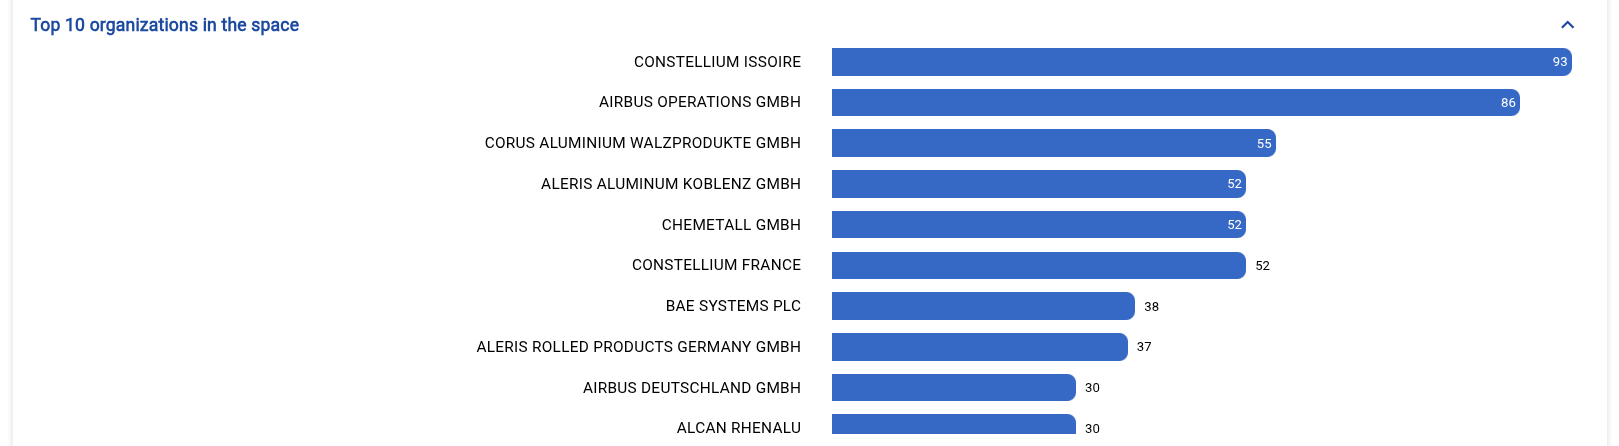
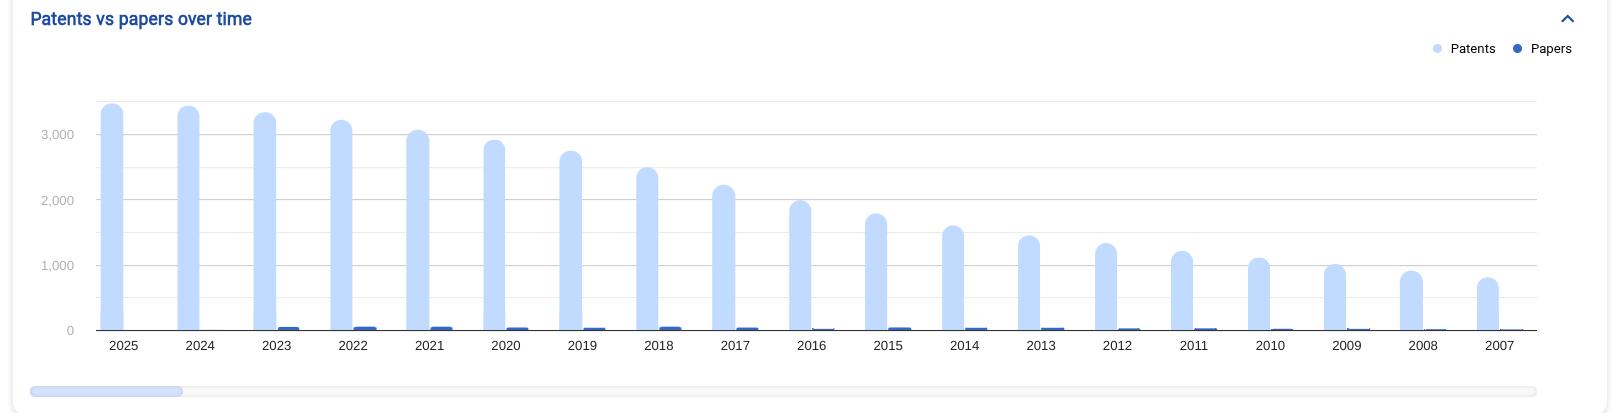
By clicking “Charts” under the Highlights section, you can see the Patent Activity Map, Top 10 Organizations in the space, and Patents vs papers over time.
To scroll through time, click and drag the sidebar underneath the graph.
You’re able to click on each dataset within the charts to focus on that specific region, organization, and time period.
Cypris Highlights
The Highlights section is designed to provide an overview of key activities in your market within a given time frame based on your search results.
You will see the number of Research Papers, Patents and Organizations relevant to your search.
You can filter your search results by Relevance and Date by clicking the drop-down arrow.
Additionally, you will see AI Insights under the Highlights section based on your search results.
Click on each insight to read AI summaries based on your search results.
By clicking “Charts” under the Highlights section, you can see the Patent Activity Map, Top 10 Organizations in the space, and Patents vs papers over time.
To scroll through time, click and drag the sidebar underneath the graph.
You’re able to click on each dataset within the charts to focus on that specific region, organization, and time period.
Register here
Subscribe to receive the latest blog posts to your inbox every week.
Thank you! Your submission has been received!
Oops! Something went wrong while submitting the form.
Keep Reading
July 6, 2026
•
XX
min read
Product update
Today we’re launching chemical structure drawing in Cypris Q, giving users a new way to start research from the structure itself, not just from text.
Until now, chemical prompts in Q began with written descriptions, compound names, CAS numbers, or other identifiers. Now, users can draw a compound or reaction directly in the editor, and Q will read the structure, include it in the prompt context, and analyze it through the Cypris Intelligence Layer.
This is an important step forward for chemical, IP, and R&D teams. It brings structure-first reasoning into the same environment where teams already search across patents, papers, regulatory sources, commercial data, and compound intelligence.
Draw compounds and reactions directly in Q
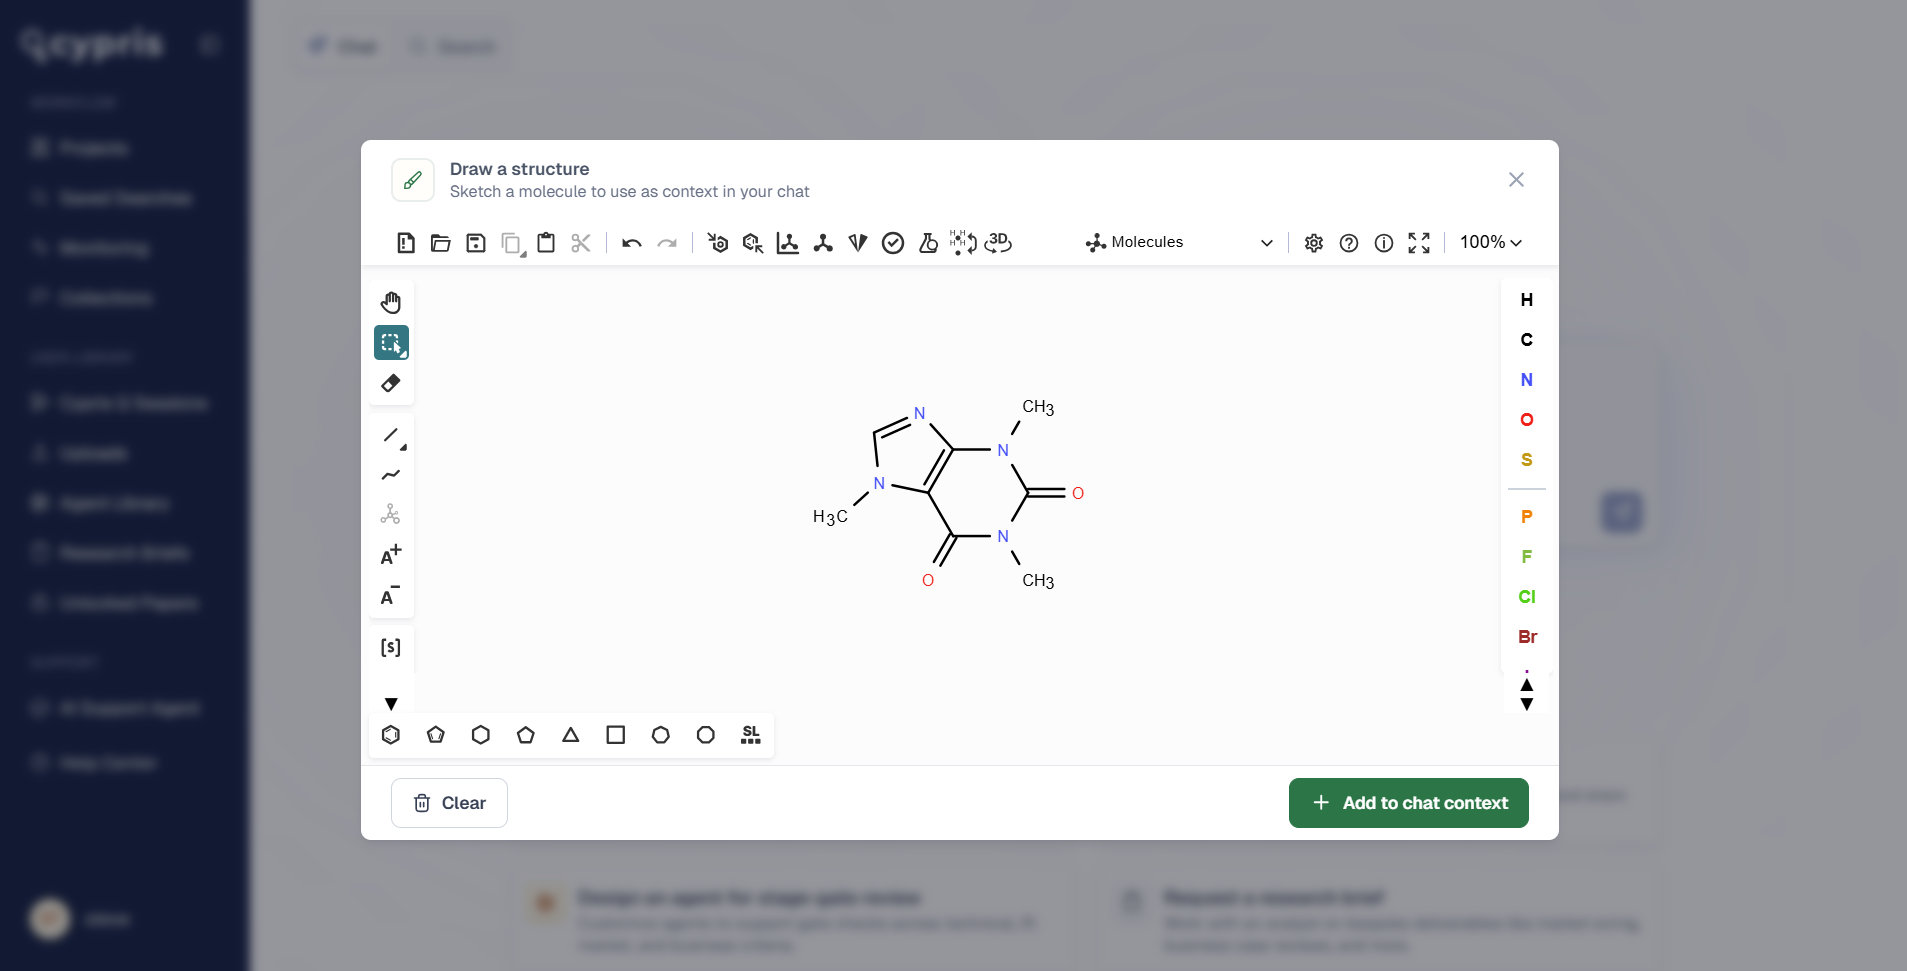
Users can now open the structure editor from the toolbox in Cypris Q and sketch a molecule or reaction on the canvas.
The editor supports atom and bond tools, common ring systems and functional groups, stereochemistry, R-group and S-group handling, and structure clean-up. Users can paste an existing structure or start from scratch, making it easier to move from an idea, molecule, or reaction scheme into a research workflow.
Add multiple structures to a single prompt
Q also supports multiple structures in the same prompt.
This is useful when comparing compounds, evaluating related molecules, working across a reaction, or asking Q to reason over a broader chemical set. Instead of describing each structure in text, users can provide the structures directly and ask Q to analyze them in context.
Verify structures with SMILES and InChIKey
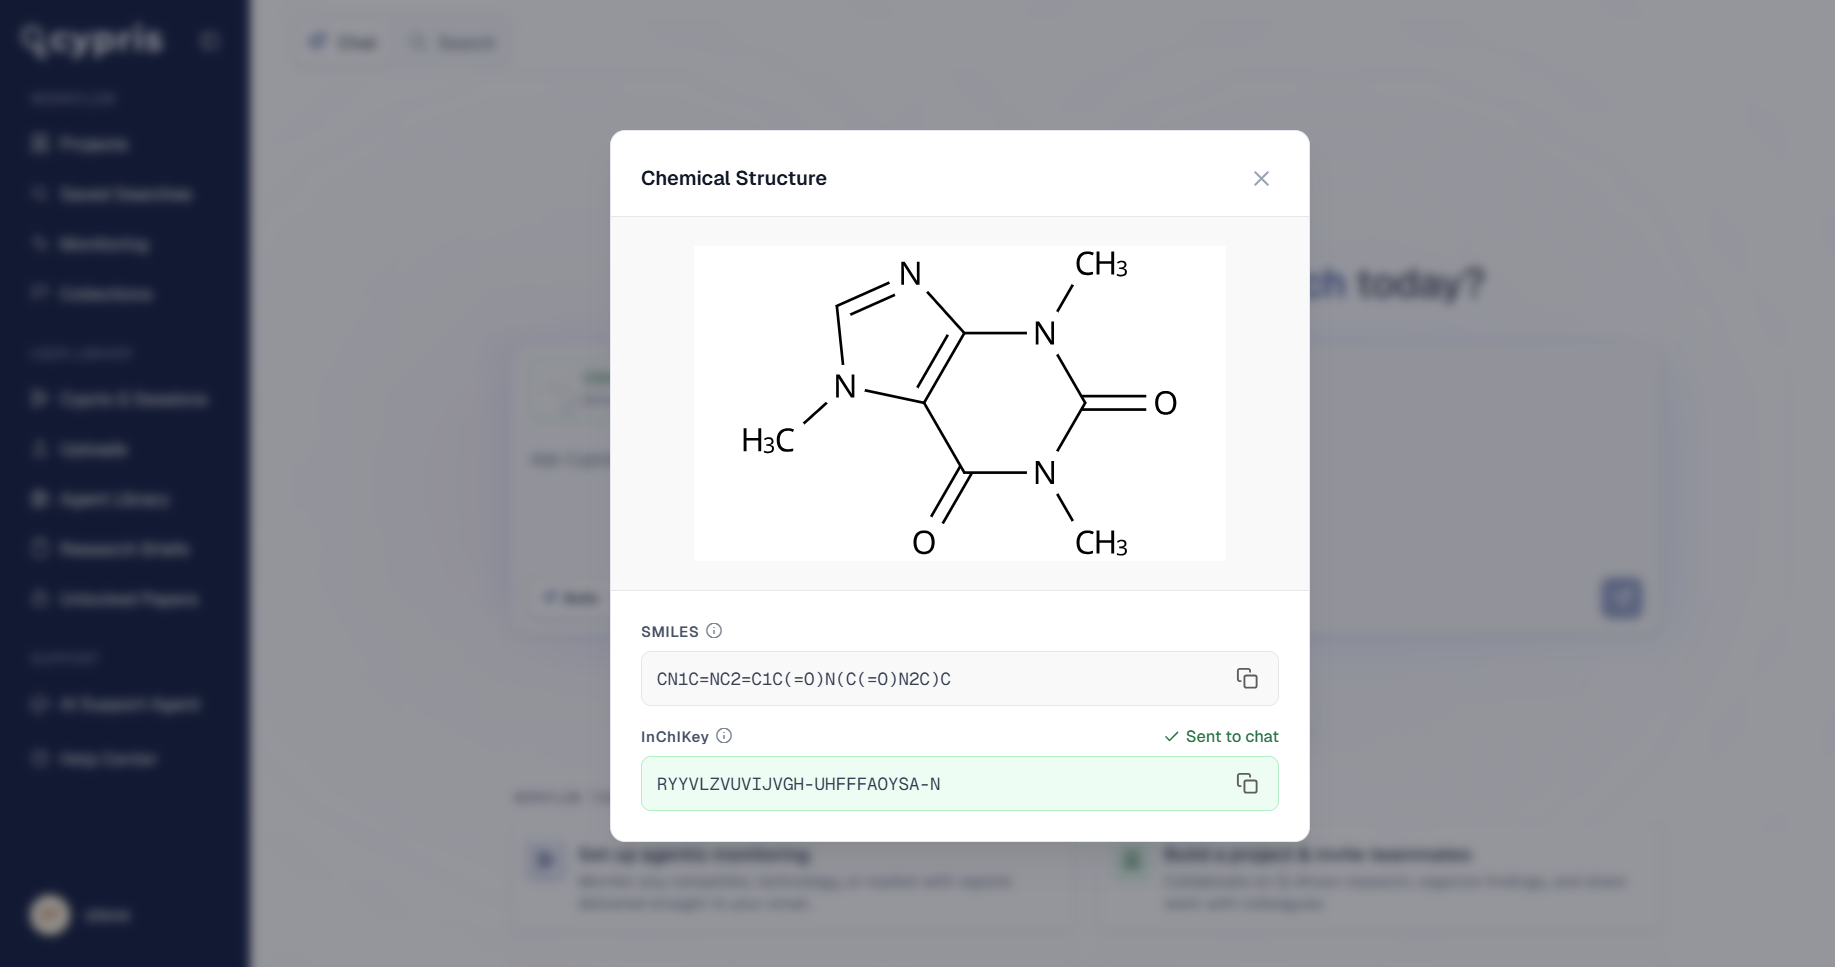
Each drawing is converted into SMILES and InChIKey representations, both visible and copyable in Q.
This gives users a clear way to verify what Q read from the drawing and carry those identifiers into other workflows, databases, or internal systems. It also helps ensure that the structure being analyzed is the one the user intended.
Mapped through the Cypris Intelligence Layer
Once a structure is added to a prompt, Cypris runs it through the Cypris Intelligence Layer.
That means Q can connect the drawn structure to chemical synonym resolution, related compounds, regulatory sources, patents, papers, and commercial intelligence. Rather than treating the drawing as an isolated image, Q understands it as structured chemical context that can be used for deeper research and analysis.
This opens up a new class of workflow for chemical research inside Cypris. Users can now ask questions from the structure outward, using Q to reason across the global landscape surrounding a compound, molecule family, or reaction.
Available now
Chemical structure drawing is available now to all Cypris customers.
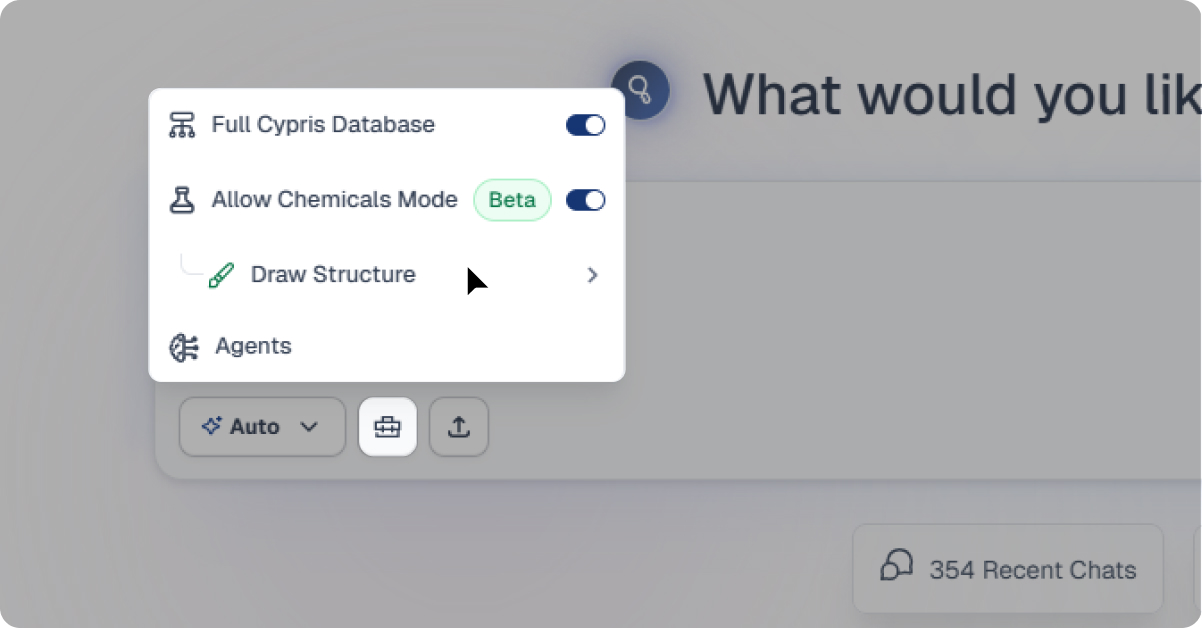
To access it, open Cypris Q, click into the toolbox in the chat window, and select Draw Structure.
Chemical Structure Drawing
All
July 1, 2025
•
XX
min read
The Main Features of Monitoring
Regular updates delivered directly to your email inbox in easy-to-use Excel format
Stay current on important industry activity by defining your schedule for receiving monitoring reports from Cypris
Automatically send monitoring reports to a custom audience of your choosing within your organization
Where to Find Monitoring
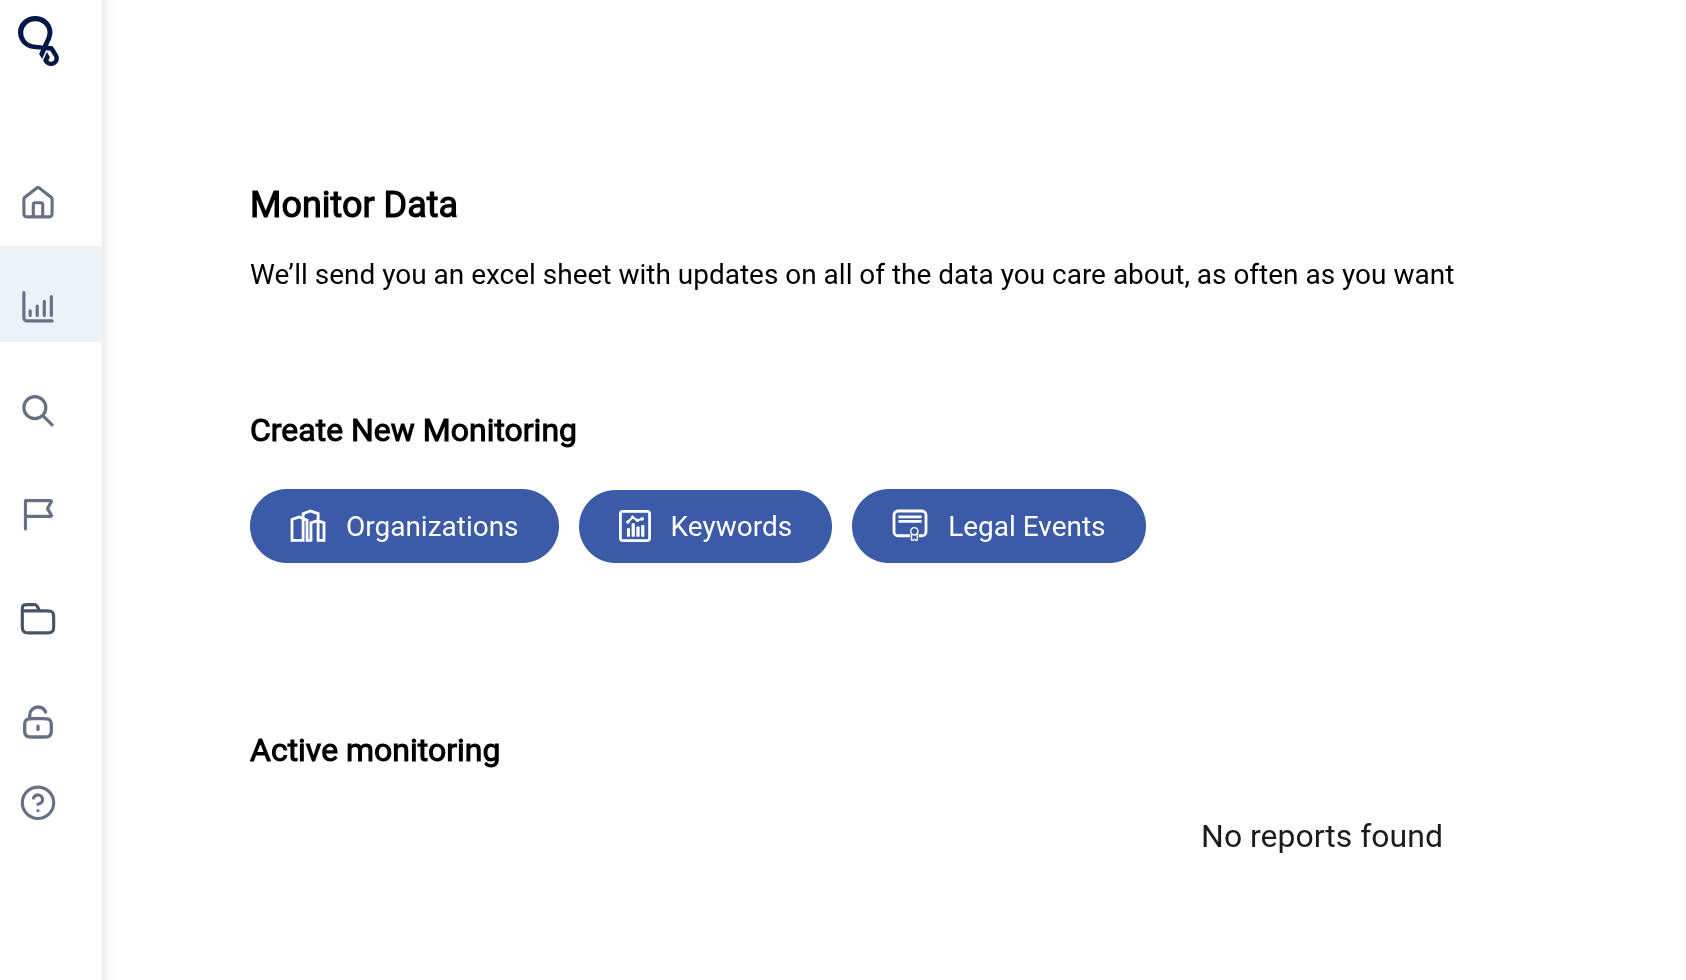
You can access monitoring from the home screen of your dashboard by selecting the "Monitoring" tab on the left hand panel. Alternatively, you can perform a search and add monitoring to your search using the button on the top right of your screen.
Types of Monitoring
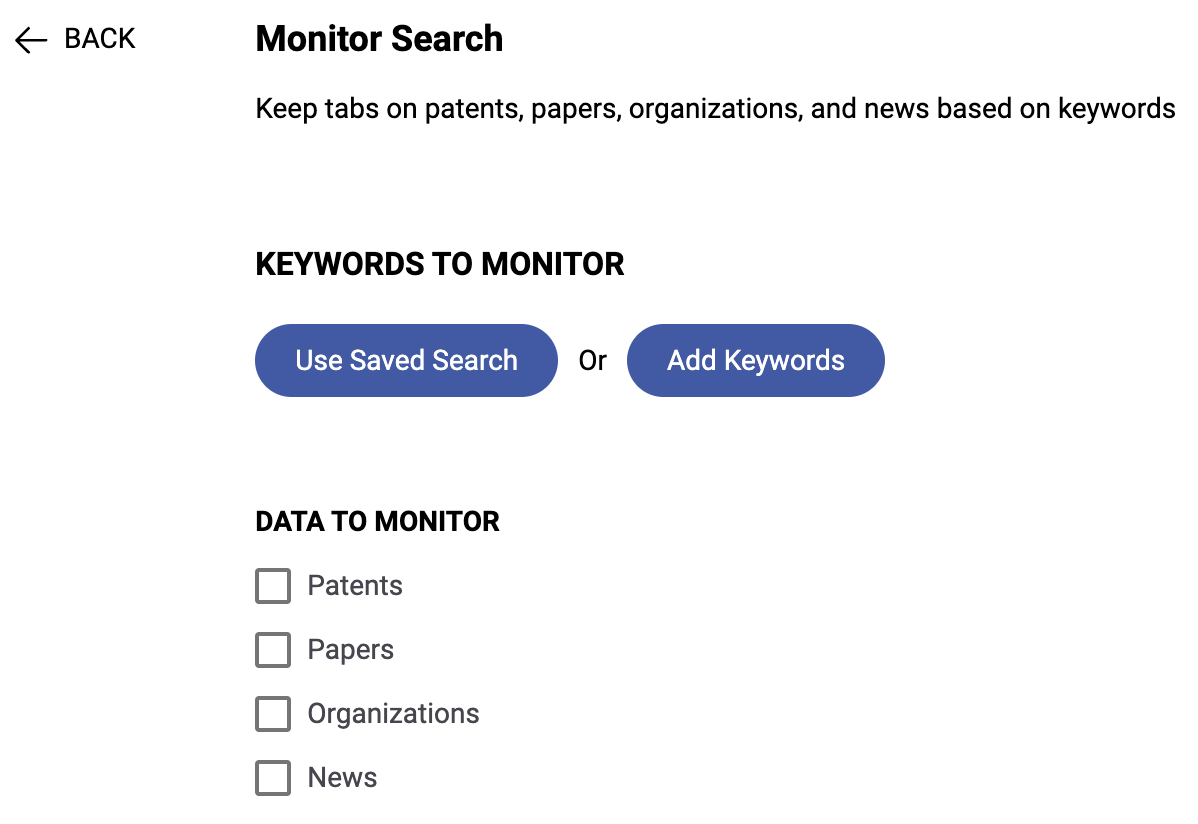
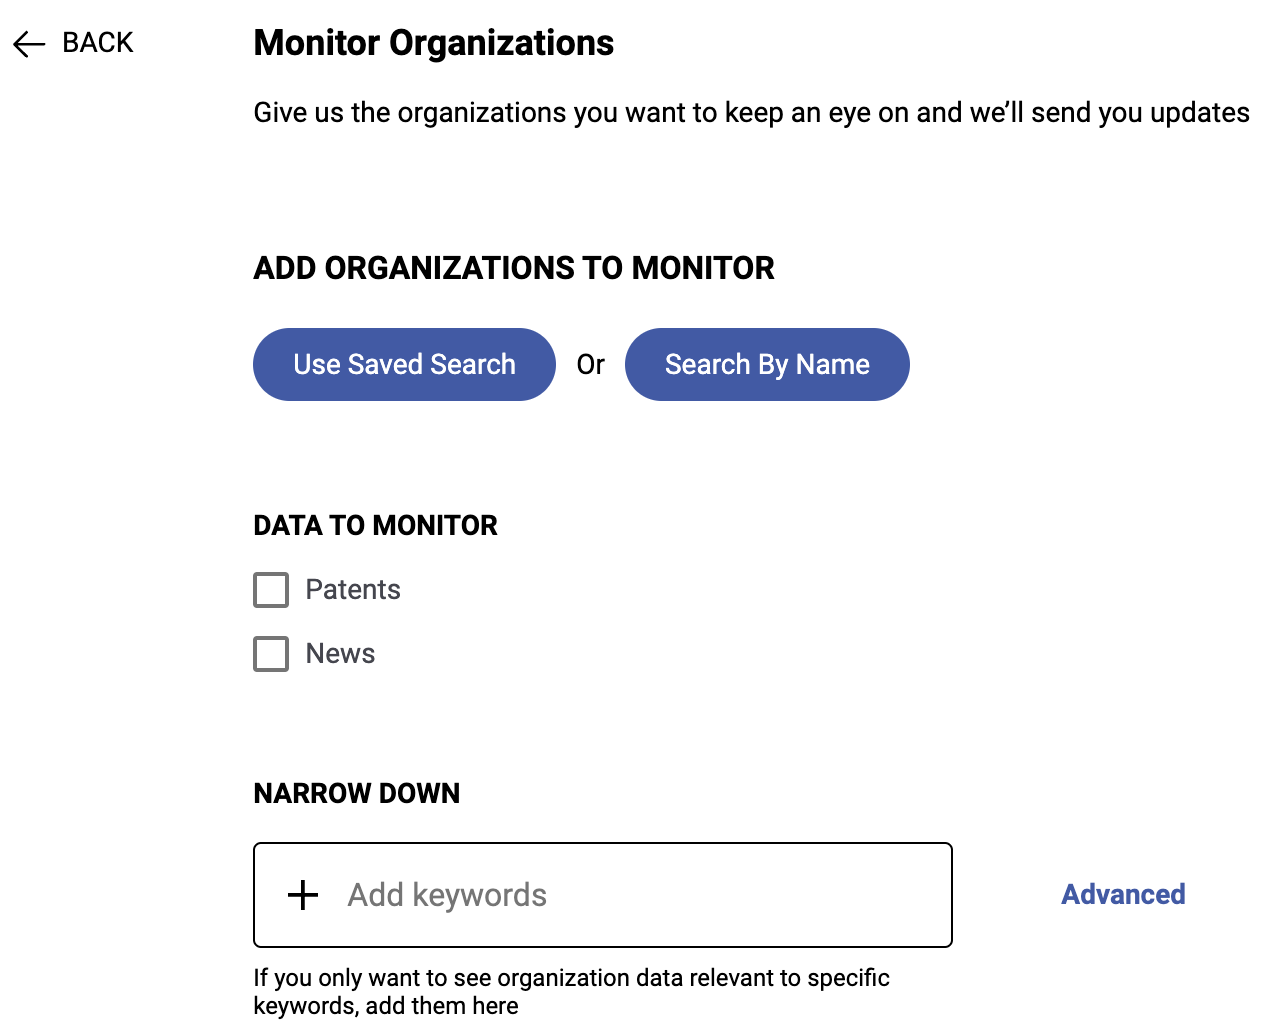
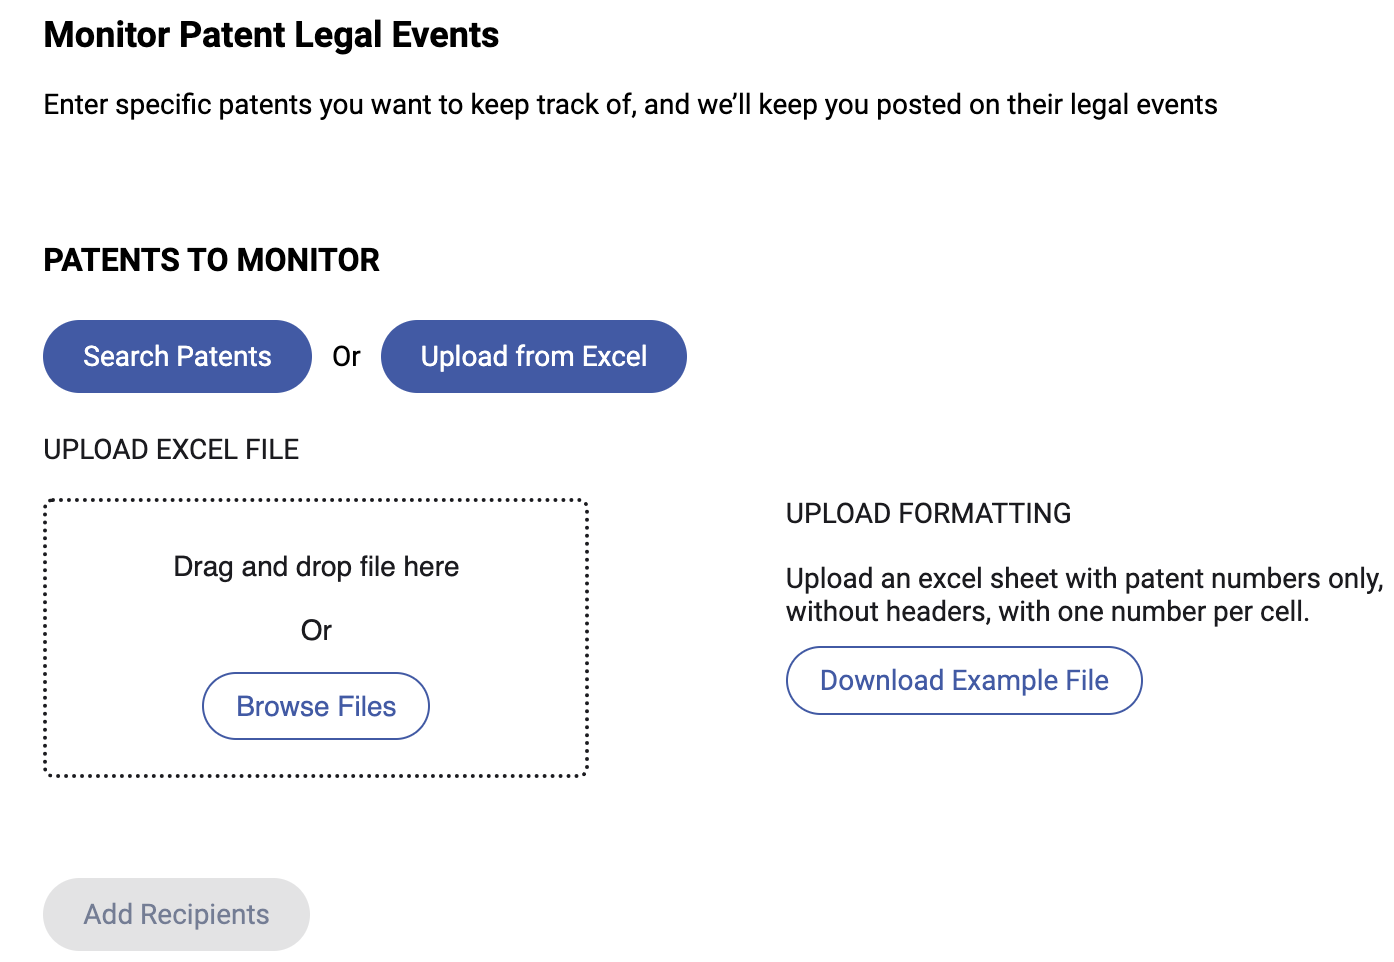
There are 3 types of monitoring within the dashboard: Organizations, Keywords, and Legal Events. Continue reading below for a general overview of these sections or skip to the unique article for your desired monitoring type.
Track activity surrounding a specific topic by using queries from previous searches or create new ones to stay up to date on the latest data
Receive updates on any combination of patents, papers, news, and organizations since your last monitoring delivery
Organization Monitoring:
Track organizations using pre-saved Company Reports or add companies of interest using our Company Search interface
Get updates on patents and news content related to these organizations on a frequency of your choosing
Legal Events Monitoring:
Add patents by publication number from an Excel or CSV document or through our patent search directly in the monitoring set-up
Receive the latest legal events for US and Global patents at the time of delivery
As always, your feedback is crucial to our ongoing improvement efforts. Please don't hesitate to reach out with any comments, questions, or suggestions. Thank you for being a valued member of the Cypris community!
How to Use Monitoring
All
July 1, 2025
•
XX
min read
New to Cypris or need a refresher? This step-by-step walkthrough will guide you through the Cypris dashboard, showing you how to navigate the platform, run searches, explore insights, and make the most of our AI-powered research tools. Whether you're tracking IP trends, reviewing technical literature, or identifying market opportunities, this tutorial will help you get up to speed quickly.